Minnesota Water Science Center

MN PUBLICATIONS
ABOUT THE MINNESOTA
|
Variability of Nutrients in Streams in Part of the Upper Mississippi River Basin, Minnesota and WisconsinBy Sharon Kroening and James StarkOriginally published as U.S. Geological Survey Fact Sheet FS-164-97Physical conditions differ among the Mississippi River and its major tributaries in Minnesota and Wisconsin. Analysis of the environmental framework of the basin and analysis of historical water-quality information by the National Water-Quality Assessment (NAWQA) Program shows that nutrients (nitrogen and phosphorus) in streams in the Upper Mississippi River Basin are influenced primarily by land use. In the Mississippi River, nutrient concentrations were greater downstream of the Minnesota River and major wastewater discharge points in the Twin Cities Metropolitan Area (TCMA). Stream loads of nutrients (the amount of the constituent carried past a point on a stream during a given period of time) also increased downstream of the Minnesota River and major wastewater discharge points in the TCMA. National Water-Quality Assessment ProgramIn 1994, the U.S. Geological
Survey's National Water-Quality Assessment (NAWQA) Program began studies
in the Upper Mississippi River Basin. Goals of NAWQA are to document the
quality of surface and ground water throughout the Nation and to explain
natural and human factors affecting water quality and changes in water
quality over time. One of the initial objectives of the Upper Mississippi
River Basin study was to summarize existing stream-water nutrient concentrations,
loads and yields from samples collected by various agencies from water
years 1984-93. Data sources were the Twin Cities Metropolitan Council Environmental
Services, Minnesota Pollution Control Agency, Wisconsin Department of Natural
Resources, and the U.S. Geological Survey.
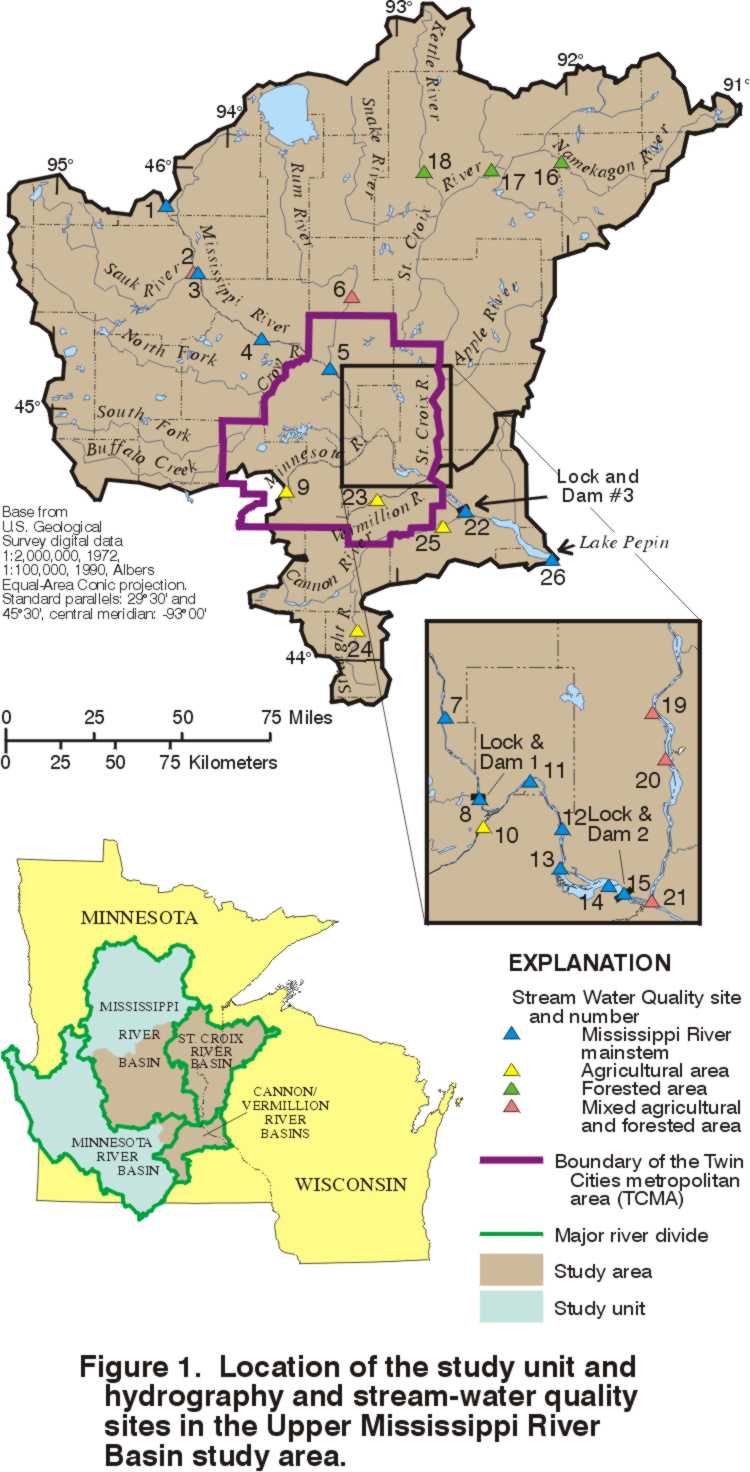
The Upper Mississippi
River Basin study unit (fig.
1) encompasses an area of about 47,000 square miles (mi2) and includes
the drainage area of the Mississippi River from the source at Lake Itasca
to the outlet of Lake Pepin, a natural lake on the river, and its four
principal tributaries--the Minnesota, St. Croix, Cannon, and Vermillion
Rivers. The seven-county Twin Cities (Minneapolis and St. Paul) metropolitan
area (TCMA) is located in the southeastern part of the study unit. Land
use in the basin can be categorized by three zones: an agricultural zone
across the southwestern one-third of the basin; a forested zone across
the northeastern one-third of the basin; and a transitional zone between
these areas.
For this paper, water-quality
analyses focused on a 19,500 mi2 study area located in the southeastern
part of the study unit. Principal streams draining the study area (in addition
to the mainstem of the Mississippi River) include the Minnesota, St. Croix,
Sauk, Rum, Namekagon, Kettle, Vermillion, Straight, and Cannon Rivers.
Land use in each of these basins is diverse. The Minnesota, Vermillion,
Straight, and Cannon Rivers drain areas with predominantly agricultural
land. The upper part of the St. Croix River and the Kettle and Namekegon
Rivers and drain areas that are primarily forested. The Sauk, Rum, and
lower part of the St. Croix River drain areas with mixed forest and agricultural
land.
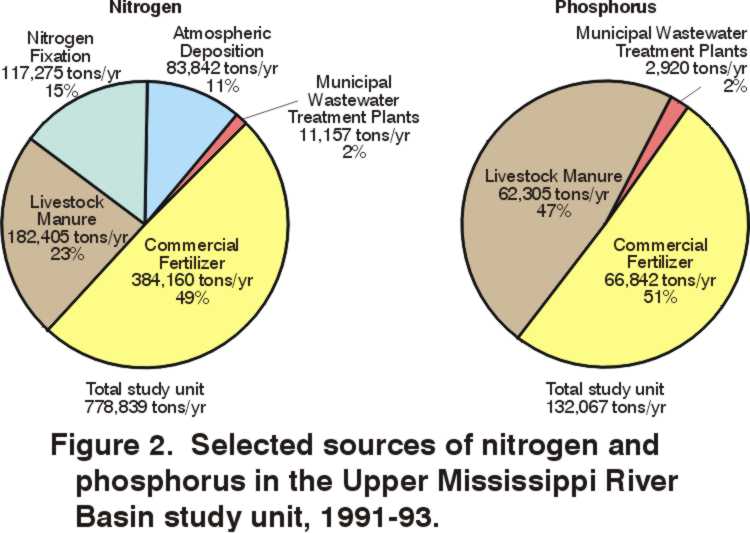
Where Do Nitrogen and Phosphorus in Streams Come From?Sources of nitrogen and
phosphorus include: fertilizer; human, animal and industrial waste; soil;
decomposition of plant and animal matter; atmospheric gases; and emissions
from vehicles and power plants. Runoff, soil erosion, atmospheric deposition,
and direct discharges can transport nitrogen and phosphorus from these
sources to streams.
Sources of nitrogen and
phosphorus from fertilizer application, livestock manure generation, wastewater
treatment-plant discharge, atmospheric deposition, and nitrogen fixation
were quantified for the entire study unit. Fertilizer and livestock manure
were the largest of the quantifiable sources of nutrients in the study
unit (fig. 2).
However, municipal wastewater discharge may be a more substantial source
of nutrients to streams than indicated because the effluent generally is
discharged directly to streams.
What are the concerns about Nitrogen and Phosphorus?Nitrogen and phosphorus
are essential nutrients for plant and animal growth. The principal forms
found in streams are nitrate (NO3-), organic nitrogen, ammonia (NH4+),
orthophosphate (PO43-), and organic phosphorus. Of these forms, ammonia,
nitrate, and orthophosphate are most readily assimilated by stream biota.
Elevated nitrate concentrations
in drinking water pose a human health concern, especially for young children
who may develop methemoglobinemia (blue baby syndrome). As a result, the
U. S. Environmental Protection Agency (USEPA, 1994) has established 10
mg/L (milligrams per liter) as the maximum contaminant level (MCL) allowed
in drinking water. Elevated ammonia concentrations in streams may increase
concentrations of un-ionized ammonia (NH3), which can kill fish and other
aquatic life.
An overabundance of nitrogen
and phosphorus in slow-moving reaches of streams, and in lakes and reservoirs
can cause eutrophication, which is the excessive growth of aquatic plants,
particularly algae. Excessive plant growth is aesthetically unpleasant
for swimming and boating. As the vegetation decays, oxygen is depleted
and the water body may become unable to support desirable species of fish.
Phosphorus is often the limiting nutrient for plant growth. To control
eutrophication, the USEPA (1986) recommends that total phosphate concentrations
should not exceed 0.1 mg/L as phosphorus in streams. At a point where a
stream enters a lake or reservoir, the USEPA recommends that total phosphate
concentrations should not exceed 0.05 mg/L as phosphorus (United States
Environmental Protection Agency, 1986).
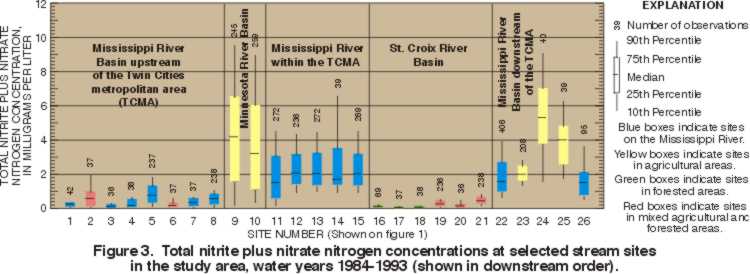
How Much Nitrogen Is In the Mississippi River and Its Tributaries?In the Mississippi River,
nitrate (nitrite plus nitrate as N) concentrations (based on water years
1984-93 data) were substantially greater downstream of the Minnesota River
(fig.
1, fig. 3)
than upstream. Upstream of the Minnesota River at sites 1, 3, and 4 (fig.
1), the greatest nitrate concentrations generally occurred during the
winter (December through March). In contrast, the greatest nitrate concentrations
occurred during the spring and early summer (April through July) at all
sites downstream of the confluence with the Minnesota River. Ammonia concentrations
generally were greatest at sites located in the TCMA downstream of Minnesota
River and the major wastewater discharge points. The greatest ammonia concentrations
occurred during the winter months, probably a result of greater concentrations
permitted in wastewater effluent during the winter (C. Larson, 1997, personal
commun., Metropolitan Council Environmental Services).
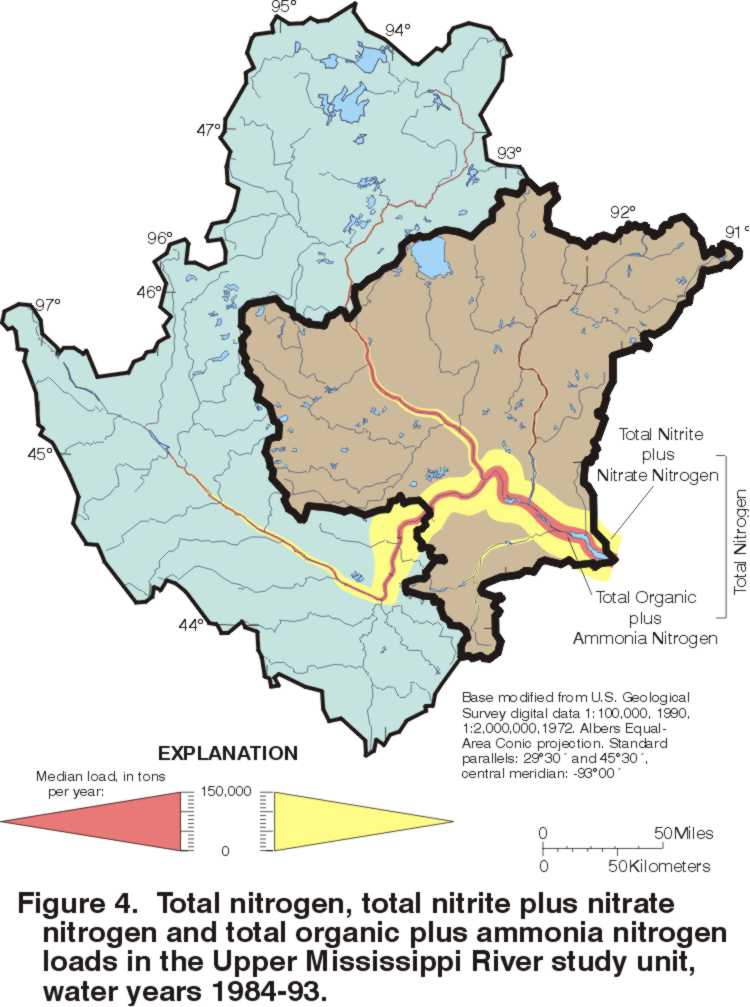
Stream load is the total
amount of a constituent that is carried past a point on a stream during
a given period of time, usually one year. Nitrate loads in the Mississippi
River increased substantially downstream of the confluence with the Minnesota
River (fig. 4).
The nitrogen load in the Mississippi River changes from predominantly organic
and ammonia nitrogen upstream of the Minnesota River to predominantly nitrate
downstream of the confluence with the Minnesota River. Most of the organic
and ammonia nitrogen load in the Mississippi River was primarily contributed
by the drainage upstream of the TCMA and the Minnesota River (fig.
4).
In the tributaries to
the Mississippi River, nitrate concentrations were greater in the Minnesota,
Vermillion, Straight, and Cannon Rivers, which drain agricultural lands,
relative to concentrations in the Sauk, Rum, Namekagon, and Kettle Rivers
(fig.
1, fig. 3).
Concentrations of nitrate were least in the Namekagon and Kettle Rivers,
which drain forested areas. In the Minnesota, Straight, and Cannon Rivers,
concentrations of nitrate generally were greatest during the spring and
summer. In contrast, concentrations of nitrate generally were greatest
during the winter in the streams draining forested, and mixed forest and
agricultural lands (Kroening and Andrews, 1997).
Yield is the load divided
by the stream's drainage area. Nitrate yields were greatest in the Minnesota,
Vermillion, and Straight Rivers, which drain areas with predominantly agricultural
land (table 1).
Nitrate yields were least at sites on the St. Croix and Kettle Rivers,
which drain predominantly forested land. Organic and ammonia nitrogen was
the predominant form of nitrogen load in tributaries draining these areas.
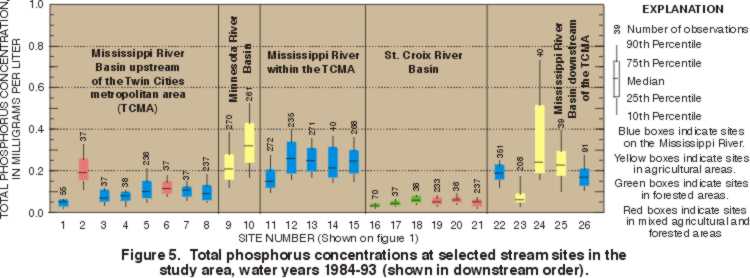
How Much Phosphorus Is In the Mississippi River and its Tributaries?In the Mississippi River
mainstem, total phosphorus concentrations were greatest downstream of the
confluence with the Minnesota River and the major wastewater discharge
points (sites 12-15, and 22; fig.
1, fig. 5).
At these sites, concentrations frequently exceeded the recommended criteria
of 0.1 mg/L.
Another study has indicated
that total phosphorus concentrations in the Mississippi River within the
TCMA were related with streamflow conditions (Kroening, 1994). During low-flow,
total phosphorus concentrations increased substantially downstream of the
TCMA's major wastewater discharge point. Under average and high-flow, the
greatest increases in total phosphorus concentrations were downstream of
the confluence with the Minnesota River.
In tributaries to the
Mississippi River, total phosphorus concentrations were greatest in the
Sauk, Minnesota, Straight, and Cannon Rivers, which drain mixed forest
and agricultural and agricultural lands (sites 2, 9, 10, 24, 25; fig.
1, fig. 5),
relative to concentrations in the St. Croix, Namekagon, and Kettle Rivers
(sites 16-21; fig.
1, fig. 5).
Concentrations frequently were greater than the recommended criteria of
0.1 mg/L in the Sauk, Minnesota, Straight, and Cannon Rivers.
Total phosphorus concentrations
generally peaked during the spring and summer at most sites in the study
area. In streams, phosphorus is often associated with clay particles. Greater
concentrations during the spring and summer may have been the result of
runoff and erosion.
In the Mississippi River,
total phosphorus loads followed a pattern similar to nitrate. The greatest
total phosphorus loads were downstream of the confluence with the Minnesota
River and the major wastewater-discharge points from the TCMA. The Minnesota
River has the greatest affect on total phosphorus loads in the Mississippi
River during above-average streamflow, when it has contributed approximately
50 percent of the total phosphorus load to the Mississippi River (Kroening,
1994; Metropolitan Waste Control Commission, 1993).
Total phosphorus yields
were greater in the Minnesota and Straight Rivers (table
1, fig. 1)
than in the Rum, St. Croix, Kettle, and Vermillion Rivers. The greater
yield in the Minnesota and Straight Rivers may be the result of drainage
from agricultural land.
Have Concentrations of Nitrogen and Phosphorus Changed Over Time?Despite increases in fertilizer
usage from 1982 to 1991, most streams outside of the TCMA have no identifiable
trends in concentrations of nitrate or total phosphorus from 1984 through
1993. Most streams had decreases in ammonia concentrations from water years
1984 through 1993, possibly a result of improvements in wastewater treatment.
In the TCMA, decreases in ammonia concentrations in the Mississippi and
Minnesota Rivers coincided with increases in nitrate concentrations, probably
a result of wastewater-treatment plants installing nitrification treatment
systems.
References |
![]() Order USGS maps, products, and publications
Order USGS maps, products, and publications
![]() U.S. Department of the Interior |
U.S. Geological Survey
U.S. Department of the Interior |
U.S. Geological Survey
URL: http://mn.water.usgs.gov/publications/pubs/164-97/text.html
Page Contact Information: Webmaster
Page Last Modified: Wednesday, 14-Jan-2009 13:13:53 EST

