Minnesota Water Science Center
|
ABOUT THE MINNESOTA
|
Current Issues in the Minnesota Water Science CenterWhite Bear Lake Project in the NewsPerry Jones, Hydrologist, was recently interviewed by Tom Snell, Executive Director with the White Bear Lake Chamber of Commerce. Their discussion of the White Bear Lake project covered possible causes for the decline in water level as well as potential actions that can be taken to bring the water level back up. Wastewater Indicator Compounds in Wastewater Effluent, Surface Water, and Bed Sediment in the St. Croix National Scenic Riverway and Implications for Water Resources and Aquatic Biota, Minnesota and Wisconsin, 2007-08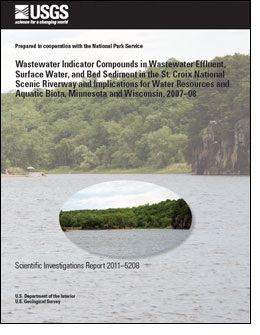
The U.S. Geological Survey and the National Park Service cooperated on a study to determine the occurrence of wastewater indicator compounds including nutrients; organic wastewater compounds (OWCs), such as compounds used in plastic components, surfactant metabolites, antimicrobials, fragrances, and fire retardants; and pharmaceuticals in the St. Croix National Scenic Riverway in Minnesota and Wisconsin. Samples of treated wastewater effluent from two wastewater-treatment plants (WWTPs), located in St. Croix Falls, Wisc. (SCF-WWTP) and Taylors Falls, Minn. (TF-WWTP), were collected from 2007 to 2008. During this time, surface-water and bed-sediment samples from the St. Croix River below Sunrise River near Sunrise, Minn., upstream from the two WWTPs (Sunrise site), and from the St. Croix River above Rock Island near Franconia, Minn., downstream from the WWTPs (Franconia site), also were collected. The Franconia site was selected because of the two large WWTP discharge points and the presence of mussel beds in this area of the St. Croix River. Trends in Suspended-Sediment Loads and Concentrations in the Mississippi River Basin, 1950-2009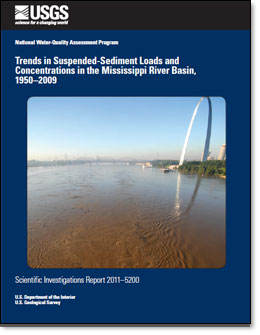
Trends in loads and concentrations of suspended sediment and suspended sand generally were downward for stations within the Mississippi River Basin during the 60-, 34-, and 12-year periods analyzed. Sediment transport in the lower Mississippi River has historically been, and continues to be, most closely correlative to sediment contributions from the Missouri River, which generally carried the largest annual suspended-sediment load of the major Mississippi River subbasins. The closure of Fort Randall Dam in the upper Missouri River in 1952 was the single largest event in the recorded historical decline of suspended-sediment loads in the Mississippi River Basin. Impoundments on tributaries and sediment reductions as a result of implementation of agricultural conservation practices throughout the basin likely account for much of the remaining Mississippi River sediment transport decline. Scour of the main-stem channel downstream from the upper Missouri River impoundments is likely the largest source of suspended sand in the lower Missouri River. The Ohio River was second to the Missouri River in terms of sediment contributions, followed by the upper Mississippi and Arkansas Rivers. Declines in sediment loads and concentrations continued through the most recent analysis period (1998-2009) at available Mississippi River Basin stations. Analyses of flow-adjusted concentrations of suspended sediment indicate the recent downward temporal changes generally can be explained by corresponding decreases in streamflows. New Report Released - SIR 2011-5096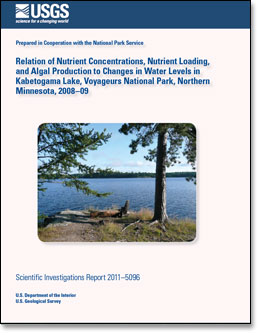
This report documents water- and sediment-quality data collected during 2008-09 to assess internal and external nutrient loading to Kabetogama Lake in Voyageurs National Park. Data collection was focused in Kabetogama Lake and its inflows, the area of greatest concern for eutrophication among the lakes of Voyageurs National Park. Nutrient and algal data were used to determine trophic status and were evaluated in relation to changes in Kabetogama Lake water levels following changes to dam operation starting in 2000. Stratification, combined with larger bottom-water nutrient concentrations, bottom sediment phosphorus concentrations, and estimated phosphorus release rates from sediment cores indicate that Lost Bay may be one of several areas that may be contributing substantially to internal loading. Comparisons of the results of this study to previous studies indicate that chlorophyll-a concentrations and trophic state indices have improved since 2000, when the rules governing dam operation changed. New USGS Study Finds Increasing Nitrate in Upper Mississippi RiverAt the Mississippi River at Clinton, Iowa, which receives drainage largely from Minnesota, annual flow-normalized nitrate concentrations increased 76% from 1980-2008. USGS WaterAlert Service Now LiveNow you can receive instant, customized updates about water conditions by subscribing to WaterAlert, a new service from the U.S. Geological Survey. Whether you are watching for floods, interested in recreational activities or concerned about the quality of water in your well, WaterAlert allows you to receive daily or hourly updates about current conditions in rivers, lakes and groundwater when they match conditions of concern to you. Learn more on the Press Release page. Fall Flooding Sets RecordsHeavy rainfall resulted in record flooding on the Minnesota, Straight, Cannon, and Zumbro Rivers. The Zumbro River at Zumbro Falls (streamgage 05374000), in the southeast part of the state, recorded a peak stage of 36.2 ft. This breaks the previous record of 30.8 ft set in 1951. The Straight River near Faribault (streamgage 05353800), also in the southeast, set a record stage and streamflow on 9/24/2010 of 14.95 ft and 12,300 cubic feet per second (cfs), respectively. The previous record stage was 11.3 ft with a streamflow of 6,080 cfs. For the Le Seuer River near Rapidan (streamgage 05320500), in south-central Minnesota, a peak stage 21.40 ft occurred on 9/26/2010 which was the third highest peak stage of record. A corresponding streamflow of 30,600 cfs may be the largest ever. USGS crews made more than 40 streamflow measurements on 26 different river locations in southern Minnesota. These measurements ensure that streamflow reported on the web are accurate and of help to the National Weather Service in predicting stream-flood peaks. New Nutrient Enrichment Effects (NEET) Paper Has Been PublishedWe are pleased to announce the publication of a paper from the Nutrient Enrichment Effects (NEET) topical study which is part of the National Water Quality-Assessment (NAWQA) Program. This paper examines the influence of nutrients and stream habitat on benthic and seston chlorophyll and presents a conceptual model illustrating why streams or regions deviate from expected patterns. The full citation of the paper is: This study examined the relative influence of nutrients (nitrogen and phosphorus) and habitat on algal biomass in five agricultural regions of the United States. Sites were selected to capture a range of nutrient conditions, with 136 sites distributed over five study areas. Samples were collected in 2003 or 2004, and analyzed for nutrients (nitrogen and phosphorous) and algal biomass (chlorophyll a). Chlorophyll a was measured in three types of samples, fine-grained benthic material (CHLFG), coarse-grained stable substrate as in rock or wood (CHLCG), and water column (CHLS). Stream and riparian habitat were characterized at each site. TP ranged from 0.004-2.69 mg/L and TN from 0.15-21.5 mg/L, with TN concentrations highest in Nebraska and Indiana streams and TP highest in Nebraska. Benthic algal biomass ranged from 0.47-615 mg/m2, with higher values generally associated with coarse-grained substrate. Seston chlorophyll ranged from 0.2-73.1 µg/L, with highest concentrations in Nebraska. Regression models were developed to predict algal biomass as a function of TP and/or TN. Seven models were statistically significant, six for TP and one for TN; r2 values ranged from 0.03 to 0.44. No significant regression models could be developed for the two study areas in the Midwest. Model performance increased when stream habitat variables were incorporated, with 12 significant models and an increase in the r2 values (0.16-0.54). Water temperature and percent riparian canopy cover were the most important physical variables in the models. While models that predict algal chlorophyll a as a function of nutrients can be useful, model strength is commonly low due to the overriding influence of stream habitat. Results from our study are presented in context of a nutrient-algal biomass conceptual model.
Additional information and publications related to the NAWQA Nutrient Effects Team can be seen at http://wa.water.usgs.gov/neet/. A Whole System Approach to Understanding Agricultural Chemicals in the Environment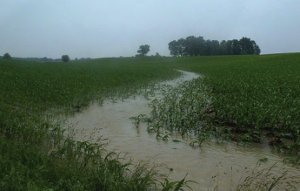 Surface runoff flows from a corn field in the Sugar Creek basin, Indiana. The effects of the use of agricultural chemicals and other practices associated with agriculture on the quality of streams and groundwater is well known; however, less is known about how those effects may vary across different geographic regions of the Nation. Scientists at the U.S. Geological Survey (USGS) are conducting studies on the transport and fate of agricultural chemicals in diverse agricultural settings across the country using comparable and consistent methodology and study designs (fig. 1; Capel and others, 2004; Capel and others, 2008). Assessments in five study areas have been completed, and the results highlight how environmental processes and agricultural practices interact to affect the movement and transformation of agricultural chemicals in the environment. The studies address major environmental compartments, including surface water, groundwater, the unsaturated zone, the streambed, and the atmosphere, as well as the pathways that interconnect these compartments. The study areas represent major agricultural settings, such as irrigated diverse cropping in the West and corn and soybean row cropping in the Midwest and, therefore, findings are relevant throughout much of the Nation. Relationship of Stream Ecological Conditions to Simulated Hydraulic Metrics Across a Gradient of Basin Urbanization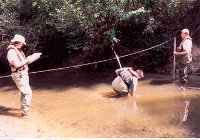 The relationships among urbanization, stream hydraulics, and aquatic biology were investigated across a gradient of urbanization in 30 small basins in eastern Wisconsin. Simulation of hydraulic metrics with 1-dimensional unsteady flow models was an effective means for mechanistically coupling the effects of urbanization with stream ecological conditions (i.e., algae, invertebrates, and fish). Urbanization, characterized by household, road, and urban land density, was positively correlated with the lowest shear stress for 2 adjacent transects in a reach for the low-flow summer (p , 0.001) and autumn (p , 0.01) periods. Urbanization also was positively correlated with Reynolds number and % exposed stream bed during months with moderate to low flows. Our study demonstrated the value of temporally and spatially explicit hydraulic models for providing mechanistic insight into the relationships between hydraulic variables and biological responses. For example, the positive correlation between filter-feeding invertebrate richness and minimum 2-transect shear stress observed in our study is consistent with a higher concentration of water-column particulates available for filtration. The strength of correlations between hydraulic and biological metrics is related to the time period (annual, seasonal, or monthly) considered. The hydraulic modeling approach, whether based on hourly or daily flow data, allowed documentation of the effects of a spatially variable response within a reach, and the results suggest that stream response to urbanization varies with hydraulic habitat type. Jeffrey J. Steuer, Jerad D. Bales, and E. M. P. Giddings, 2009, Relationship of stream ecological conditions to simulated hydraulic metrics across a gradient of basin urbanization, J. N. Am. Benthol. Soc., 28(4):955976 DOI: 10.1899/08-157.1, Published online: 27 October 2009 Mercury in Stream Ecosystems
The U.S. Geological Survey recently released a study that assesses mercury contamination in fish, bed sediment, and water from 291 streams across the nation, sampled from 1998 to 2005. Scientists detected mercury contamination in every fish sampled in every stream. About a quarter of these fish were found to contain mercury at levels exceeding the criterion for the protection of people who consume average amounts of fish, established by the U.S. Environmental Protection Agency (EPA). More than two-thirds of the fish exceeded the EPA level of concern for fish-eating mammals. Atmospheric mercury is the main source to most of these streams coal-fired power plants are the largest source of mercury emissions in the United States but 59 of the streams also were potentially affected by gold and mercury mining. Since USGS studies targeted specific sites and fish species, the findings may not be representative of mercury levels in all types of freshwater environments across the United States. The report, along with a press release, podcast, and summary of major findings can be accessed at http://water.usgs.gov/nawqa/mercury/. USGS Minnesota Water Science Center In The News
Members of the Minnesota Water Science Center were interviewed regarding the floods of 2010. One interview was with Supervisory Hydrologist James Fallon regarding the role that streamgages play in predicting droughts and floods. Another interview was with Hydrologic Technicians Dan Daly and Katie Tetrault, who demonstrated the use of an Acoustic Doppler Current Profiler (ADCP). Estimated Use of Water in the United States in 2005
Estimates of water use in the United States indicate that about 410 billion gallons per day (Bgal/d) were withdrawn in 2005 for all categories summarized in this report. This total is slightly less than the estimate for 2000, and about 5 percent less than total withdrawals in the peak year of 1980. Freshwater withdrawals in 2005 were 349 Bgal/d, or 85 percent of the total freshwater and saline-water withdrawals. Fresh groundwater withdrawals of 79.6 Bgal/day in 2005 were about 5 percent less than in 2000, and fresh surface-water withdrawals of 270 Bgal/day were about the same as in 2000. Withdrawals for thermoelectric-power generation and irrigation, the two largest uses of water, have stabilized or decreased since 1980. Withdrawals for public-supply and domestic uses have increased steadily since estimates began. Chloride in Groundwater and Surface Water in Areas Underlain by the Glacial Aquifer System, Northern United States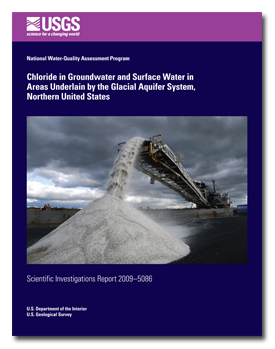 A study of chloride in groundwater and surface was conducted for the glacial aquifer system of the northern United Stats in forested, agricultural, and urban areas by analyzing data collected for the National Water-Quality Assessment Program from 1991 to 2004. Multiple linear regression analyses showed that the density of major roads, potential evapotransipration, and the percentage of annual runoff from saturated overland flow were significant factors in describing the range of maximum measured chloride concentrations in surface water from the basins studied. Upward trends is chloride yields were apparent in several urban basins. Increases in chloride loads over time may be related to a variety of factors, including increases in road area and subsequent deicing, increases in wastewater and septic-system discharges, recycling of chloride from drinking water, and leachate from landfills and salt storage areas. Urban Streams Across the USA: Lessons Learned from Studies in 9 Metropolitan Areas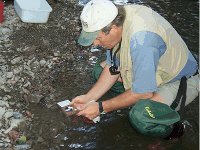 Studies of the effects of urbanization on stream ecosystems have usually focused on single metropolitan areas. Synthesis of the results of such studies have been useful in developing general conceptual models of the effects of urbanization, but the strength of such generalizations is enhanced by applying consistent study designs and methods to multiple metropolitan areas across large geographic scales. Four major conclusions emerged from these studies. First, responses of hydrologic, physical habitat, water-quality, and biotic variables to urbanization varied among metropolitan areas, except that insecticide inputs consistently increased with urbanization. Second, prior land use, primarily forest and agriculture, appeared to be the most important determinant of the response of biota to urbanization in the areas we studied. Third, little evidence was found for resistance to the effects of urbanization by macroinvertebrate assemblages, even at low levels of urbanization. Fourth, benthic macroinvertebrates have important advantages for assessing the effects of urbanization on stream ecosystems relative to algae and fishes. Overall, our results demonstrate regional differences in the effects of urbanization on stream biota and suggest additional studies to elucidate the causes of these underlying differences. Larry R. Brown, Thomas F. Cuffney, James F. Coles, Faith Fitzpatrick, Gerard McMahon, Jeffrey Steuer, Amanda H. Bell, and Jason T. May, 2009, Urban streams across the USA: lessons learned from studies in 9 metropolitan areas, J. N. Am. Benthol. Soc., 28(4):10511069, DOI: 10.1899/08-153.1, Published online: 27 October 2009 Recent NAWQA PublicationsWe are pleased to announce the publication of two journal articles from the NAWQA Program. These articles examine effects of urbanization on stream ecosystems in 9 metropolitan areas across the United States. Full citations and brief summaries follow. Online versions of the papers are available at http://www.bioone.org/toc/jnbs/28/4. Additional information about the NAWQA EUSE study is available at http://water.usgs.gov/nawqa/urban/. If you have questions about the papers contact Larry Brown or Jerad Bales. Official Release of Circular 1344: Estimated Use of Water in the United States in 2005The USGS has released the national compilation of water use for 2005 (press release). The report is currently available at the USGS publications warehouse. The USGS also released Fact Sheet 2009-3098 entitled "Summary of Estimated Water Use in the United States in 2005". Relative contributions of selected endocrine active chemicals and pharmaceuticals from wastewater treatment plant effluent and other sources to Minnesota surface waters Implications for aquatic communities The U.S. Geological Survey, Minnesota Pollution Control Agency, St. Cloud State University, and University of St. Thomas, St. Paul, MN are cooperating on a joint study to measure the concentrations of endocrine active chemicals (EACs) and pharmaceuticals in water samples collected from the effluents from 20 WWTPs and at sites upstream and downstream of WWTP effluent discharge in Minnesota during 2009-2011. |
![]() U.S. Department of the Interior |
U.S. Geological Survey
U.S. Department of the Interior |
U.S. Geological Survey
URL: http://mn.water.usgs.gov/about/current.html
Page Contact Information: Webmaster
Page Last Modified: Wednesday, 11-Jul-2012 13:31:02 EDT