Minnesota Water Science Center

MN PUBLICATIONS
ABOUT THE MINNESOTA
|
Water-Quality Assessment of the Upper Mississippi River Basin, Minnesota and Wisconsin--Polychlorinated Biphenyls in Common Carp and Walleye Fillets, 1975-95Originally published as Water-Resources Investigations Report 98-4126By Kathy E. Lee and Jesse P. AndersonAbstract
Introduction
Background
Purpose and scope
Acknowledgments
Data
sources and analyses
Data
sources
Data analyses
Spatial
distribution of polychlorinated biphenyls in common carp and walleye in
the Mississippi, Minnesota, and St. Croix Rivers
Comparison
among individual sites
Comparison among river segments
Temporal
distribution of polychlorinated biphenyls in common carp and walleye in
the Mississippi, Minnesota and St. Croix Rivers
Factors
affecting Polychlorinated biphenyl distribution
Summary
and conclusions
References
Conversion
factors, abbreviated water quality units, and abbreviations
AbstractSpatial and temporal distribution
of polychlorinated biphenyls (PCBs) in common carp (Cyprinus carpio) and
walleye (Stizostedion vitreum) fillets from rivers in the Upper Mississippi
River Basin upstream of the outlet of Lake Pepin are summarized. PCB concentrations
in common carp and walleye fillets collected from rivers in the UMIS during
1975-95 by the Minnesota Fish Contaminant Monitoring Program (MFCMP) and
the Wisconsin Department of Natural Resources (WDNR) were analyzed. PCBs
in fish tissue are of concern because PCBs are potentially toxic, teratogenic,
and are linked to poor fetal development and endocrine disruption in fish
and other animals including humans, that consume fish. This summary was
part of an analysis of historical data for the Upper Mississippi River
(UMIS) study unit of the National Water-Quality Assessment (NAWQA) Program.
The UMIS study unit is a 47,000 square-mile basin that includes the drainage
of the Mississippi River upstream of the outlet of Lake Pepin and encompasses
the Twin Cities metropolitan area. PCB concentrations for individual samples
at all sites ranged from 0.07 to 33.0 milligrams per kilograms (mg/kg)
for common carp and from 0.07 to 9.8 mg/kg for walleye during 1975-95.
During 1975-79 and 1980-87, 10 and 4 percent of walleye samples and 45
and 36 percent of common carp samples, respectively, exceeded the U.S.
Food and Drug Administration guideline of 2 mg/kg PCB in fish tissue. PCB
concentrations in individual common carp and walleye samples were below
2 mg/kg after 1987. Median PCB concentrations at individual sites and within
stream segments were generally greatest in common carp and walleye from
Mississippi River segments in the TCMA during 1975-79 and 1980-87. There
was a significant difference among lipid-normalized PCB (LNPCB) concentrations
in common carp, considering all stream segments combined, during all three
time periods (1975-79, 1980-87, and 1988-95). LNPCB concentrations in common
carp and walleye at those stream segments upstream or outside the TCMA
were generally lower than those in UMR segments within the TCMA. The spatial
distribution of PCB and LNPCB concentrations in common carp and walleye
correspond with historical point- and non point-source PCB inputs in the
densely populated TCMA, and concentrations in fish were greater in areas
that historically had elevated PCB concentrations in bed sediment.
Median PCB concentrations
in common carp and walleye at individual sites were greatest during 1975-79
and 1980-87, and least during 1988-95 at most sites. Most of the river
segments exhibited over 80 percent decline in median PCB concentrations
in common carp and walleye between the 1975-79 and 1988-95 time periods.
The results from these temporal analyses were similar to those of other
studies in the United States and in Minnesota and Wisconsin that reported
a significant downward trend in PCB concentrations in fish. Although, PCB
concentrations have decreased during 1975-95, low concentrations of PCBs
still remain in the aquatic environment despite the fact that PCBs were
banned nearly 20 years ago.
Back to top IntroductionIn 1991, the USGS began full
implementation of the NAWQA Program. Long-term goals of the NAWQA Program
are to describe the status of and trends in the quality of large representative
areas of the Nation's surface-water, aquatic-community, and ground-water
resources, and to identify some of the natural and human factors that affect
the quality of these resources (Gilliom and others, 1995). To meet these
goals, nationally consistent data are being collected and analyzed. Because
assessment of the water quality in the entire Nation is impractical, major
activities of the NAWQA Program take place within a set of hydrologic systems
called study units. Study units comprise diverse hydrologic systems of
river basins, aquifer systems, or both.
The UMIS NAWQA study unit,
which encompasses an area of about 47,000 mi2, includes the entire drainage
of the Mississippi River upstream from the outlet of Lake Pepin located
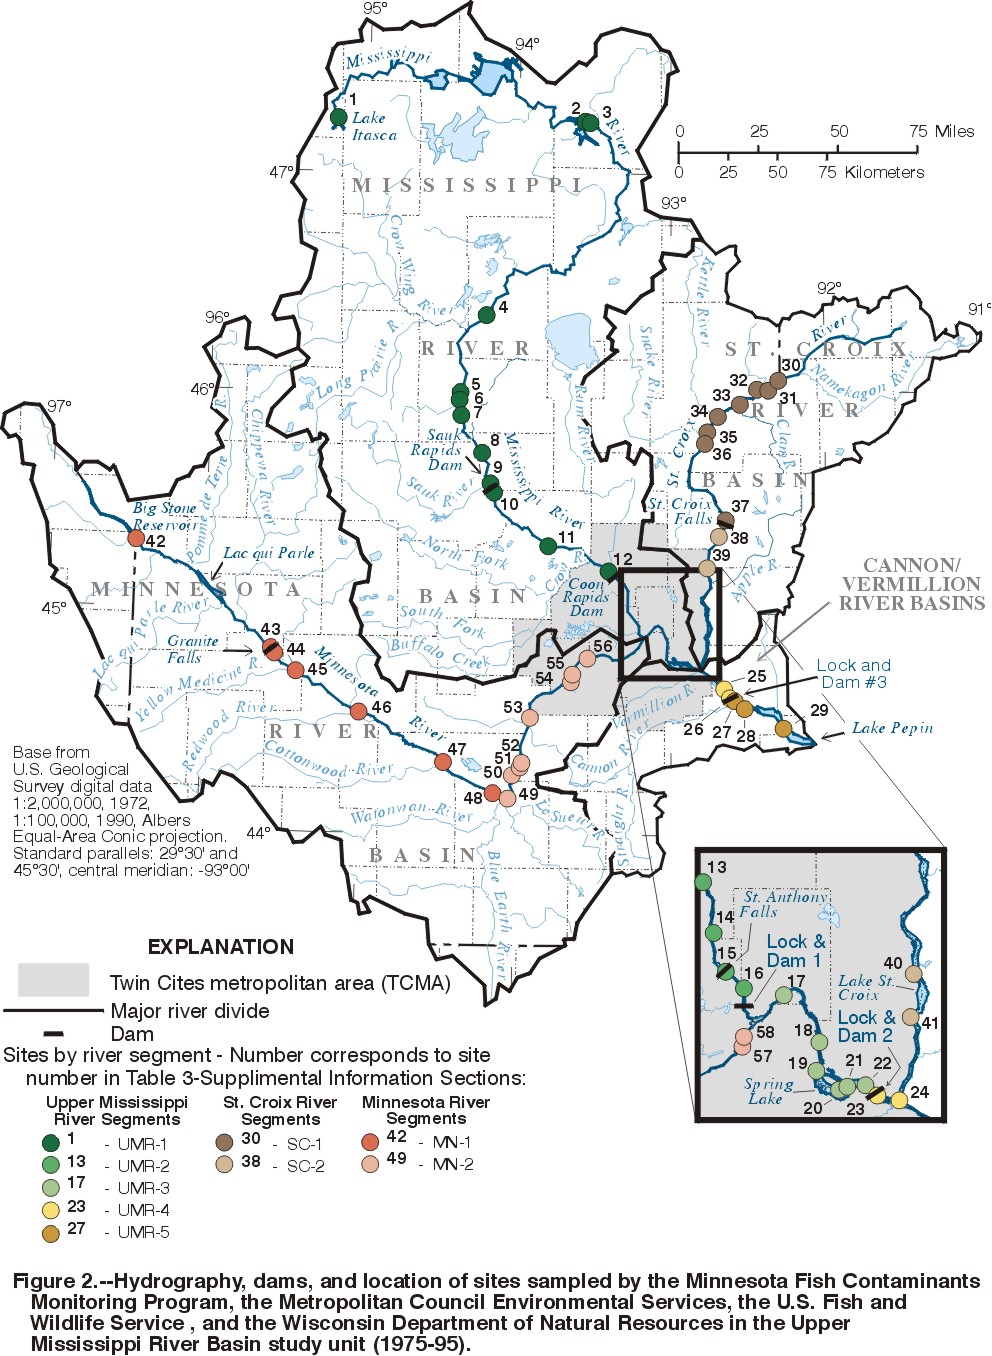
downstream of Red Wing, Minnesota (fig.
1). Diverse land cover, including forests, wetlands, and agricultural
and urban areas, characterizes the UMIS study unit. A complete description
of the environmental setting of the study unit can be found in Stark and
others (1996).
Three major rivers (Mississippi,
St. Croix, and Minnesota) flow through the UMIS study unit. The Mississippi
River begins at Lake Itasca in northern Minnesota, and flows generally
south through extensive forested and wetland areas. It also flows through
the TCMA, which is the largest population center in the UMIS having an
estimated population of 2.3 million (Stark and others, 1996). The Mississippi
River provides drinking water, commercial transportation, wastewater dilution,
and recreation. Lock and dam structures on the Mississippi River create
a system of pooled areas upstream of dams (fig.
2). Pool 2, the largest pool in the TCMA, receives most of the major
industrial and municipal discharges (greater than 1 Mgal/d) (Anderson,
1997). The Minnesota River primarily drains agricultural land in southwestern
Minnesota, and passes through small urbanized areas prior to flowing through
the TCMA. The St. Croix River drains primarily forested land in eastern
Minnesota and western Wisconsin; however, the St. Croix River is more urbanized
downstream of St. Croix Falls (fig.
1).
BackgroundPCBs are a family of organic
compounds that are produced by substituting chlorine atoms for hydrogen
atoms on a biphenyl molecule. There are 209 possible PCB isomers, depending
on the number and location of chlorine atoms surrounding the biphenyl molecule
(Eisler, 1986). PCBs tend to sorb to sediment because they are not readily
soluble in water. PCBs are on the U.S. Environmental Protection Agency's
Priority Pollutant list of toxic chemicals for which the agency intends
to promulgate discharge control standards (Chapman and others, 1982). Commercial
PCB mixtures on the priority pollutant list include Aroclors 1016, 1221,
1232, 1242, 1248, 1254, and 1260 (Chapman and others, 1982). The first
two digits of the Aroclors signify the number of carbon atoms in the biphenyl
molecule, and the last two numbers indicate the percent of the sample,
by weight, that is chlorinated (Eisler, 1986). Degradation of PCBs is slow,
and forms with a greater percentage of chlorine are generally more persistent
(Eisler, 1986).
PCBs were commonly used in
dielectric fluids, hydraulic fluids, heat-transfer fluids, sealants, and
marine paint from 1929-74. After 1974, PCBs were used in closed systems
such as dielectric fluid in transformers (U.S. Environmental Protection
Agency, 1992). An estimated 90 percent of all capacitors manufactured in
the 1970's contained PCBs and over 90 million capacitors were produced
yearly (Durfee, 1976). Production of PCBs in the United States ceased in
1977 and production of PCBs was banned in the United States in 1979. Despite
this ban, PCBs are still widely detected in the aquatic environment (Sullivan,
1988; Eisler, 1986; Schmitt and others, 1990).
PCBs have been detected in
fish tissue and sediment from every major river in the United States, probably
due to runoff from contaminated surfaces, dispersal of contaminated sediments
within rivers, atmospheric deposition, and point source discharges (Eisler,
1986; Schmitt and others, 1990). The major anthropogenic factor that affects
PCB occurrence in streams is the location of the stream relative to PCB
sources such as transformers, point source discharges from wastewater treatment,
nonpoint sources such as storm-water runoff from contaminated surfaces,
and atmospheric deposition from incinerators (Hora, 1984; Sullivan, 1988).
These sources generally occur with greater frequency in urban areas.
Natural factors also affect
the movement and distribution of PCBs in streams. PCBs tend to be sorbed
to sediments and are transported and deposited with sediments. Sediments
tend to be deposited in pools and backwaters in large rivers, and can be
resuspended during periods of high flow or dredging. Sediment re-suspension
during high-flow events and dredging can reintroduce PCBs into the aquatic
environment and extend their environmental impacts (Sullivan, 1988).
Fish and other aquatic organisms
are exposed to PCBs through direct intake of contaminated water and sediments,
or through consumption of contaminated food. Concentrations of PCBs in
fish tissue are primarily dependent upon where the fish live (their habitat),
what they feed upon (their trophic status), and other factors such as their
lipid content and age. Fish that live in close contact with sediments and
feed on organisms that live in the sediments are likely to ingest PCBs
from contaminated prey and incidentally from contaminated sediments. Fish
that inhabit areas that are not associated with sediment receive PCBs mainly
through ingestion of contaminated prey.
Once PCBs have entered the
food chain in organisms at the lower trophic levels (algae, macrophytes,
and benthic invertebrates), they are passed to organisms higher on the
food chain such as fish, birds, and ultimately humans. PCBs have the potential
to bioaccumulate in organisms and biomagnify through food chains. Bioaccumulation
occurs because less PCBs are excreted or metabolized than are ingested.
Biomagnification occurs when PCB concentrations are increased at each step
higher in the food chain.
Locally, in Minnesota and
Wisconsin, PCBs in fish are a human and ecosystem health concern. Both
Minnesota and Wisconsin Departments of Health have established fish-consumption
advisories for PCBs (Minnesota Department of Health, 1998; Wisconsin Department
of Health and Wisconsin Department of Natural Resources, 1997). PCBs became
an important issue in Minnesota and Wisconsin in 1975 when the USFDA restricted
the interstate shipment of common carp ( Cyprinus carpio ) taken
from Lake Pepin because PCB concentrations exceeded the 5 milligrams per
kilogram (mg/kg) commercial action level (Interagency Task Force, 1976;
Hora, 1984; Sullivan, 1988). This USFDA action prompted the development
of an Interagency Task Force to determine the extent of PCB contamination
in Minnesota and Wisconsin (Interagency Task Force, 1976). The Interagency
Task Force, which was comprised of local, state and Federal agencies, completed
a study in 1975 to identify PCB concentrations in fish, sediment, water,
and point sources.
Several other studies of PCBs
have been completed nationwide and in the UMIS. PCBs in bed and suspended
sediment, fish and invertebrate tissues have historically been greater
within and downstream of the TCMA than upstream (Hora, 1984; Sullivan,
1988; Biedron and Helwig, 1991; Steingraeber and others, 1994; Rostad and
others, 1995). Other studies have shown that PCB concentrations in sediment
and fish have declined after the compounds were banned in 1979 (Hora, 1984;
Sullivan, 1988; Schmitt and others 1990; Biedron and Helwig, 1991).
PCBs in fish tissue are of
concern because PCBs are potentially toxic, teratogenic, and have been
linked to poor fetal development and endocrine disruption in fish and other
animals including humans, that consume fish, (Eisler, 1986; Colburn and
Clement, 1992; Jacobson and Jacobson, 1993). Because of the potential effects
of PCBs on environmental and human health, it is important to develop strategies
of management of PCBs. An understanding of PCB spatial and temporal trends
is necessary to develop these strategies.
Purpose and ScopeThe purpose of this report
is to describe the spatial distribution and the temporal trends of total
PCBs in common carp and walleye ( Stizostedion vitreum ) fillets
collected from rivers in the UMIS study unit for 1975-95. Data from the
three major rivers in the study unit--the Mississippi, the Minnesota, and
the St. Croix Rivers--are summarized. Data are analyzed through graphical
and statistical methods.
AcknowledgmentsThe authors thank the following
members of the Upper Mississippi River Basin National Water Quality Assessment
Program liaison committee for their reviews of this report: Marc Briggs,
John Sullivan, Patty King, and Hillary Carpenter. The authors also express
appreciation to the following agencies for assistance in compiling data
used in this report: Metropolitan Council Environmental Services, Minnesota
Department of Health, Minnesota Department of Natural Resources, and Wisconsin
Department of Natural Resources. The authors also thank the following U.S.
Geological Survey colleagues: William Andrews, Robert Goldstein, Lawrence
Deweese, and James Stark for their reviews of this report; Paul Hanson
for his geographic-information-system assistance; Ginger Amos for her editorial
review of this report; and Mark Brigham, Dave Lorenz, and James Fallon
for their technical assistance.
Data Sources and AnalysesData SourcesPCB concentration data for
common carp and walleye fillets were obtained from electronic data bases
and paper files from monitoring programs conducted by the MFCMP (a joint
effort of the MDH, MDNR, and MPCA) MCES, USFWS, and the WDNR. Each agency
had specific purposes for data collection.
The primary objective of the
MFCMP is to determine the extent of chemical contamination of fish in Minnesota
waters and to develop a fish-consumption advisory to protect human health
(Minnesota Department of Natural Resources, 1994). The first advisory was
published in 1985 and annual updates have been published since 1991 (Minnesota
Department of Health, 1998). The MFCMP fish-collection program focuses
on sites with a suspected contamination source, popular angling waters,
and in areas where trends are being tracked. PCB monitoring under the MFCMP
began in 1975 and continues presently. From 1975-89 the MPCA maintained
the contaminant-monitoring program. After 1989, the MDNR assumed the primary
responsibility for the operation of the Program. Various laboratories,
from 1975 through 1995, analyzed PCBs in fish for the MFCMP. A detailed
description of methods for fish collection, and laboratory analyses for
the data can be found in the 1990-92 data document (Minnesota Department
of Natural Resources, 1994). PCB concentrations in fish were reported as
total PCBs.
The WDNR monitors PCBs in
fish tissue in streams and lakes in Wisconsin primarily for the development
of a fish consumption advisory to protect human health (Wisconsin Department
of Natural Resources, 1997). WDNR's fish-collection program focuses on
sites with a suspected contamination source, popular angling waters, and
in areas where trends are being tracked (Wisconsin Department of Health
and Wisconsin Department of Natural Resources, 1997). PCB concentrations
in fish were reported as total PCBs. Common carp and walleye fillet data
were collected at sites in the St. Croix and Mississippi Rivers within
the Wisconsin portion of the UMIS study unit during 1975-95.
The MCES collected common
carp fillets during 1984-88 at nine sites in the TCMA. PCB concentration
in fish fillets were collected as part of a toxics monitoring program designed
to provide information about the effectiveness of an industrial pretreatment
program and to monitor compliance with standards and criteria for toxic
pollutants (Metropolitan Council Environmental Services, 1988). Fish fillets
were analyzed for PCB Aroclors 1016, 1221, 1232, 1242,1248, 1254, and 1260.
The USFWS monitored contaminants
in fish as part of the NCBP during 1967-84, and as part of the BEST Program
since 1991. Under these two programs, the USFWS determined concentrations
of contaminants (including PCBs) in fish tissue across the United States
(Schmitt and others, 1983). Fish were analyzed for PCB Aroclors 1248, 1254,
and 1260 at two sites in the UMIS study unit; at the Mississippi River
at Little Falls, Minnesota; and the Mississippi River at Lake City, Minnesota
(Schmitt and others, 1996).
Data AnalysesPCB concentrations in common
carp and walleye fillets, with skin attached, were used for the analyses
in this report. Because PCB data were not normally distributed, nonparametric
statistical tests with a 0.05 significance level were used. The MFCMP and
the WDNR collected common carp and walleye during 1975-95, had the greatest
number of PCB analyses for common carp and walleye, and reported total
PCB concentrations. A comparison of PCB (lipid normalized, see below) concentrations
in common carp and walleye was made between the MFCMP and WDNR data collected
during 1975 at Lake Pepin. No significant differences between the data
sets were observed for common carp, based on the Mann-Whitney nonparametric
statistical test. Therefore, the MFCMP and WDNR data sets were combined.
Data from the MCES and USFWS are reviewed, however they were not combined
with the MFCMP and WDNR data sets because the periods over which MCES and
USFWS data were collected did not extend over the entire 20 year time period.
In addition, concentration of individual Aroclors was reported by MCES
and USFWS, in contrast to total PCB concentration reported by MFCMP and
WDNR.
In the original data sets
from the MFCMP and WDNR, PCB concentrations were reported for individual
fish, and for composite samples of 2 to 11 fish. No attempt was made to
adjust data analyses for number of fish composited per sample. The number
of PCB samples varied among rivers and time periods. The greatest number
of samples were collected from the Mississippi River, followed by the Minnesota
River, and the St. Croix River among all time periods (table
1).
PCB concentrations in fish
vary through space and time. To account for these factors, data were separated
spatially (into distinct river segments), and temporally (into three time
periods). Data from the Mississippi River were divided into five segments
(UMR 1-5) based on the locations of dams (fig.
2, and table 2).
Data from the St. Croix River were divided into 2 segments; one upstream
(SC-1) and one downstream of St. Croix Falls (SC-2) to the confluence with
the Mississippi River. Data from the Minnesota River were divided into
two segments: one upstream of Mankato (MN-1) and one from Mankato downstream
to the confluence with the Mississippi River (MN-2). Because PCBs in fish
tissue are known to have declined during 1975-95, data were divided into
three discrete time periods:1975-79, 1980-87, and 1988-95. The 1975-79
time period preceded the ban of PCB production. The other two periods were
split between 1980 and 1995.
Lipid content and fish length
(surrogate for fish age) may influence PCB concentrations in fish. Lipid
content in fish is important because PCBs are partitioned into and stored
in lipid tissue. Fish age (as estimated by fish length) indicates the potential
exposure period for contaminants. Because fish bioaccumulate PCBs, concentrations
in older fish are expected to be greater than in younger fish of the same
species. Without actually determining fish age through analyses of fish
scales or calcified body parts, the exact age of the fish can only be estimated
by fish length.
Spearman correlations were
used to determine the association of lipid content and fish length with
PCB concentration for common carp and walleye within all river segments
for each time period. Lipid content ranged from 0.6 to 18.9 percent in
common carp samples and from 0.1 to 5.7 percent in walleye samples among
all stream segments and time periods. In common carp, percent lipid content
was positively correlated (r>0.5) with PCB concentrations in 50 percent
of the river segments during all time periods. Lipid content in common
carp also was found to be statistically different among river segments
within each time period. Most walleye data sets generally were not large
enough (>5 samples) to determine the relation between lipid content and
PCB concentration; however, when there were sufficient data within a set,
a positive correlation between lipid content and PCB concentration was
observed. Therefore, PCB concentrations were normalized according to lipid
content. Lipid normalization for common carp and walleye samples was accomplished
by determining the milligrams of PCB per kilogram of lipid in each fish
fillet, and is indicated as LNPCB in the text.
The association of fish length
and PCB concentration was not consistent among all stream segments. There
were no significant differences in common carp length among stream segments
during any time period except during 1980-87. The correlations between
length and PCB concentration were negative in approximately 15 percent
of the segments and not strongly correlated (r < 0.3) in approximately
52 percent of the segments. The association of length and PCB concentration
for walleye was difficult to determine due to small data set size. Therefore,
to reduce potential variability due to fish length (age), data analyses
were restricted to fish with lengths ranging from 15.0-24.9 in. This range
in length coincides with the 15-20 in. and 20-25 in. size ranges used for
the Minnesota Fish Consumption Advisory (Minnesota Department of Health,
1998).
The MFCMP and WDNR data sets
contained censored values, which are concentrations that were reported
below an analytical detection limit. There were multiple detection limits
from 0.01 to 0.07 mg/kg, for common carp and walleye samples. Multiple
detection limits pose a problem for data interpretation and statistical
analyses. Therefore, the value for the highest detection limit (0.07 mg/kg)
was substituted for any sample with a concentration less than 0.07 mg/kg.
The percent of censored data during 1975-79 and 1980-87 was generally small
(less than 10 percent for both common carp and walleye) so little information
was lost by substituting 0.07 for all censored values. However, during
1988-95, the percent of censored data was 43 percent and 64 percent for
common carp and walleye, respectively. Therefore, substitution of the highest
value may result in some information loss and may overestimate median values
for that time period (Helsel and Hirsh, 1992). However, the focus of this
study was on greater differences in PCB concentrations among segments and
time periods.
Spatial analyses of PCB concentrations
in common carp and walleye include graphic comparisons among individual
sites and both graphic and statistical comparisons among stream segments
on the Mississippi, St. Croix, and Minnesota Rivers during each of three
time periods (1975-79, 1980-87, and 1988-95) (figs. 3,
4, 5,
6). Because of
small data set sizes, no statistical comparisons for spatial analyses were
made for walleye data.
Spatial analyses among individual
sites were accomplished by displaying the median concentration for each
site during each time period (figs. 3 and 4). There are 29 sites on the
Mississippi River (site numbers 1-29), 12 sites on the St. Croix River
(site numbers 30-41), and 17 sites on the Minnesota River (site numbers
42-58) (table 3).
Site locations are associated with a river mile location. River miles for
sites on the Mississippi River are given in miles upstream of the Mississippi
River at Cairo, Illinois. River miles on the Minnesota and St. Croix Rivers
are given as miles upstream from their confluence with the Mississippi
River.
Go to table 3
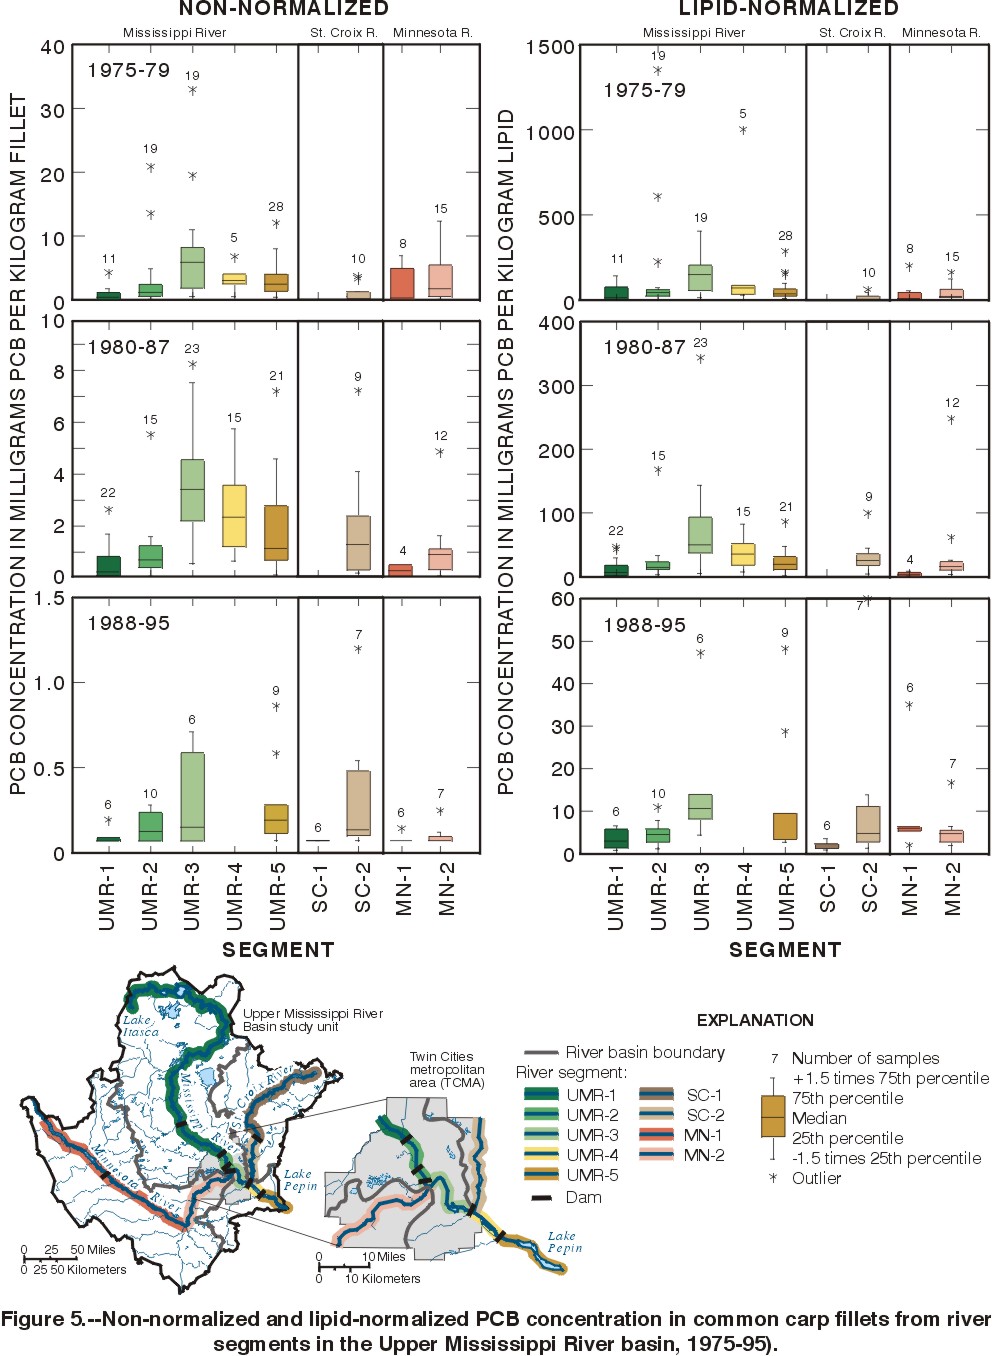
Comparisons of PCB concentrations
among river segments are assessed graphically using boxplot diagrams, and
statistically with Kruskal-Wallis and Mann-Whitney tests (Helsel and Hirsh,
1992). Both non-normalized and LNPCB concentrations are shown on boxplots;
however, statistical analyses were performed only on the LNPCB concentrations.
Differences in LNPCB concentrations among all segments were determined
using the Kruskal-Wallis test, and differences between all pairs of segments
were determined using the Mann-Whitney test.
Temporal trend evaluation of PCB concentrations in carp
and walleye included descriptive and statistical analyses. Maps and graphs
were used to describe the temporal distribution of LNPCB concentrations
in common carp and walleye within each of the three rivers. The Kruskal-Wallis
test was used to test for differences in LNPCB concentration among the
three time periods within each stream segment.
Back
to top
Back
to U.S. Geological Survey in Minnesota Home Page
Spatial Distribution of Polychlorinated Biphenyls in Common Carp and Walleye in the Mississippi, Minnesota, and St. Croix RiversSites were not sampled every
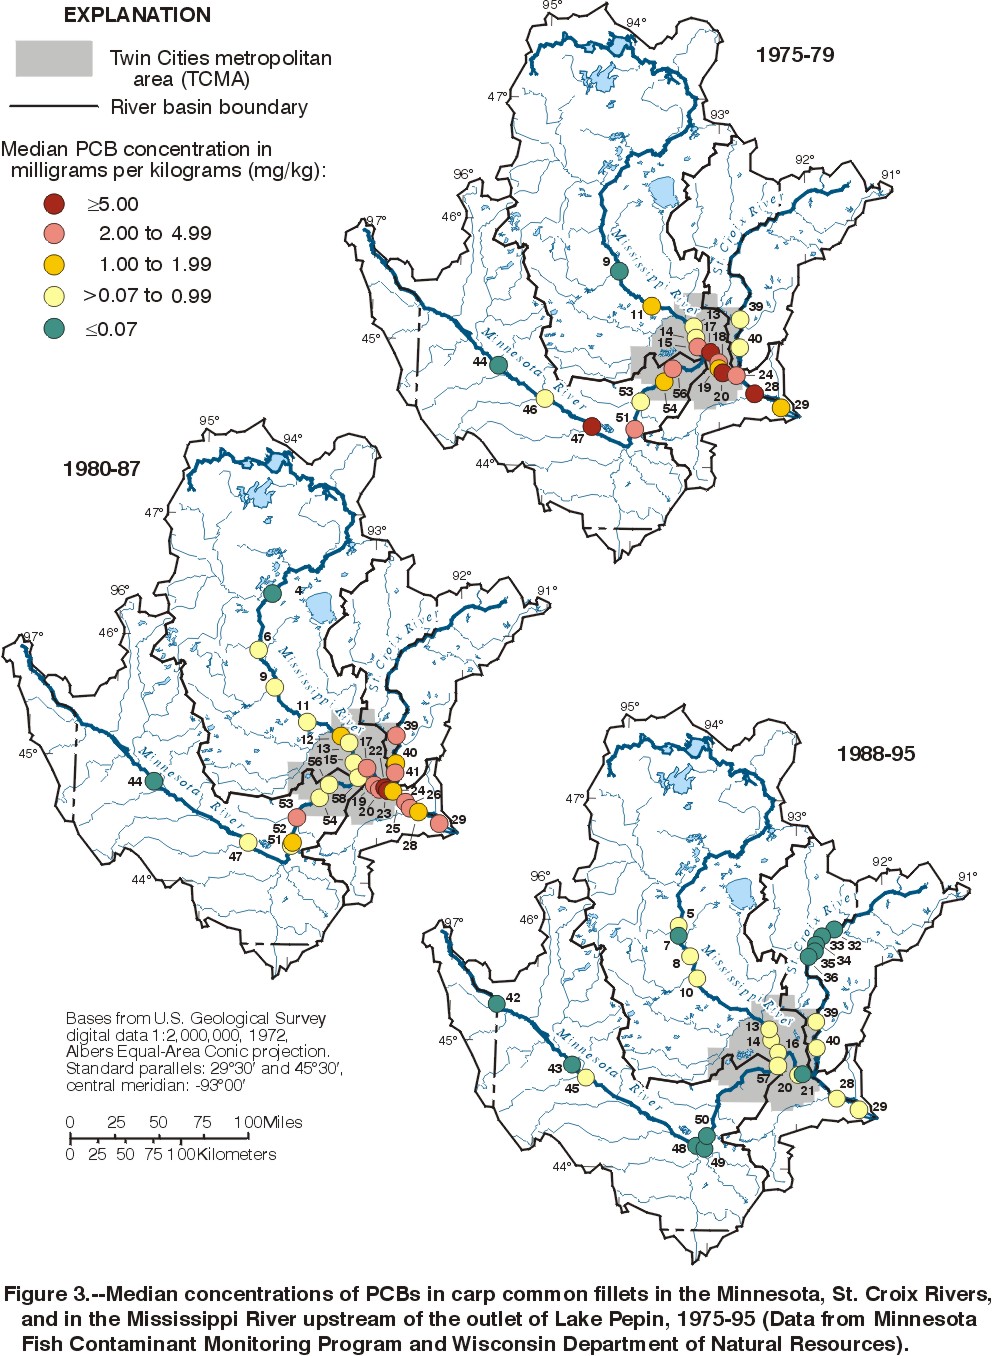
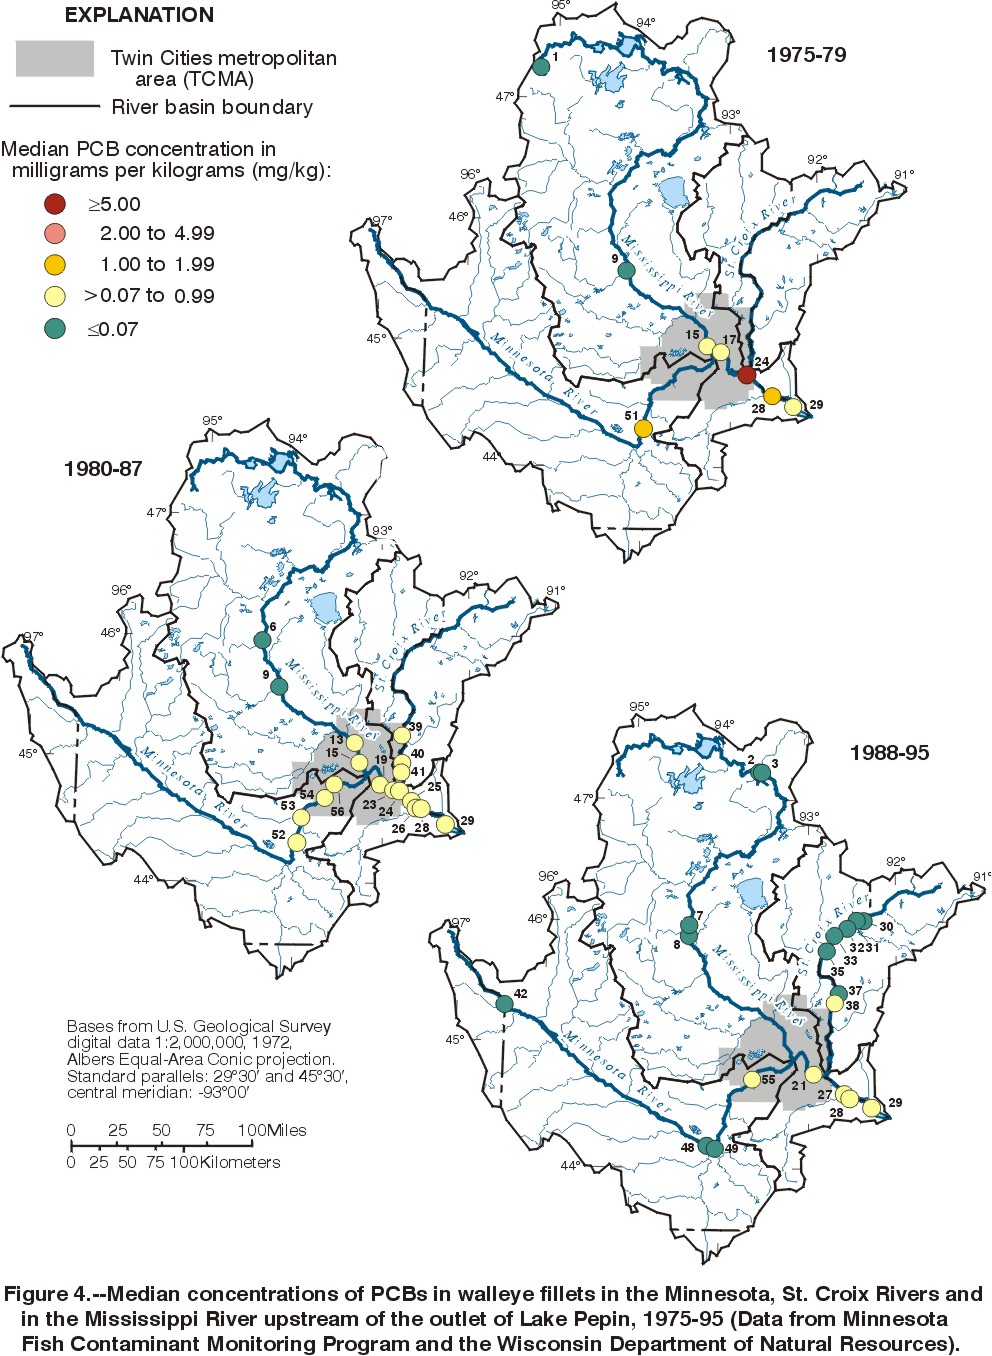
year or regularly throughout 1975-95. Figures
3 and 4 show
the spatial distribution of median PCB concentrations of common carp and
walleye, respectively, at individual sites during each of the three time
periods. Sampling sites were not the same during each period. For example,
sites upstream (sites 30-37) and downstream (sites 38-41) of St. Croix
Falls on the St. Croix River were not always sampled during the same years;
all sites upstream of St. Croix Falls were sampled during 1988-95, and
only two sites in the St. Croix River downstream of St. Croix Falls were
sampled during that period.
Comparison Among Individual SitesPCB concentrations of samples
at individual sites ranged from 0.07 to 33.0 mg/kg for common carp and
from 0.07 to 9.8 mg/kg for walleye during 1975-95 (tables
4 and 5). Maximum
PCB concentrations for individual common carp and walleye samples were
greatest in the Mississippi River (33.0 mg/kg and 9.8 mg/kg, respectively)
followed by the Minnesota (12.3 and 1.6 mg/kg, respectively) and St. Croix
(3.6 in common carp) Rivers during 1975-79 (tables 4 and 5).
During 1975-79 and 1980-87,
10 and 4 percent of walleye samples and 45 and 36 percent of common carp
samples, respectively, exceeded the USFDA guideline of 2 mg/kg PCB in fish
tissue (U.S. Food and Drug Administration, 1989). PCB concentrations in
common carp and walleye tissues were below the 2 mg/kg commercial USFDA
limit set for commercial fisheries after 1987.
Whereas median PCB concentrations
in walleye at individual sites were generally lower than those in common
carp during the 1975-79 and 1980-87 time periods, the spatial trends were
similar (figs. 3
and 4). Median
PCB concentrations in common carp and walleye at individual sites were
generally greatest in the Mississippi River within and downstream of the
TCMA (sites 13-29) during 1975-79 and 1980-87 (figs. 3 and 4). During 1975-79
and 1980-87, median PCB concentrations in common carp at individual sites
in the Minnesota River downstream of New Ulm (sites 47-58) and individual
sites in the St. Croix River downstream of St. Croix Falls (sites 38-41)
were within the range of those observed for sites in the Mississippi River
within and downstream of the TCMA (sites 13-29). During 1980-87 and 1988-95,
PCB concentrations in walleye in the St. Croix River downstream of St.
Croix Falls and in the Minnesota River downstream of Mankato were within
the range those observed for sites in the Mississippi River within and
below the TCMA.
Comparison Among River SegmentsSpatial comparison of PCB
concentrations were made among 5 segments on the Mississippi River and
2 segments on both the St. Croix and Minnesota Rivers (fig.
2, and table 2)
within the three time periods. During the three time periods, the spatial
trend was similar, although the ranges of PCB concentrations were different
(fig. 5). Ranges
and median non-normalized and LNPCB concentrations generally were greater
in common carp from Mississippi River segments in the TCMA (UMR 3-4) than
in river segments upstream or outside the TCMA during all time periods.
There was a significant difference
(P < 0.05) among LNPCB concentrations in common carp, considering all
river segments combined, during all three time periods. Median LNPCB concentrations
in common carp increased downstream in the Mississippi River from UMR-1
to UMR-3 and then decreased from UMR-3 to UMR-5 during all time periods
(fig. 5, and table
4). Common carp in UMR-3 and 4 in the TCMA generally had greater LNPCB
concentrations than other river segments. During 1975-79, UMR-3 had greater
LNPCB concentrations than all other stream segments except UMR-4 (P <
0.05). During 1980-87, UMR-3 had greater LNPCB concentrations than all
other segments (P < 0.05). During 1988-95, UMR-3 had greater median
PCB concentrations than UMR-1 and SC-1.
Non-normalized and LNPCB concentrations
in common carp at UMR-1, SC-1 and MN-1 (those segments upstream of or outside
the TCMA) generally were lower than in UMR segments in or near the TCMA
(UMR-2,3,4,5). During 1980-87, MN-1 and UMR-1 had lower LNPCB concentrations
than UMR segments in and downstream of the TCMA (P< 0.05). During 1988-95,
SC-1 had similar LNPCB concentrations to UMR-1 and lower LNPCB concentrations
than all other river segments (P < 0.05).
Generally, median non-normalized
and LNPCB concentrations in common carp in MN-2 and SC-2 were lower than
those in UMR-3, but similar to other UMR segments within and downstream
of the TCMA. During 1975-79 and 1980-88, MN-2 had lower LNPCB concentrations
than UMR-3 and similar to UMR-4 and 5 (P<0.05). During 1988-95, MN-2
was similar to all other UMR segments (p<0.05). During 1980-88, SC-2
had similar LNPCB concentrations to UMR-2,4, and 5 (P<0.05). During
1988-95, SC-2 had similar LNPCB concentrations to all other river segments
but lower LNPCB concentrations than SC-1 (p<0.05).
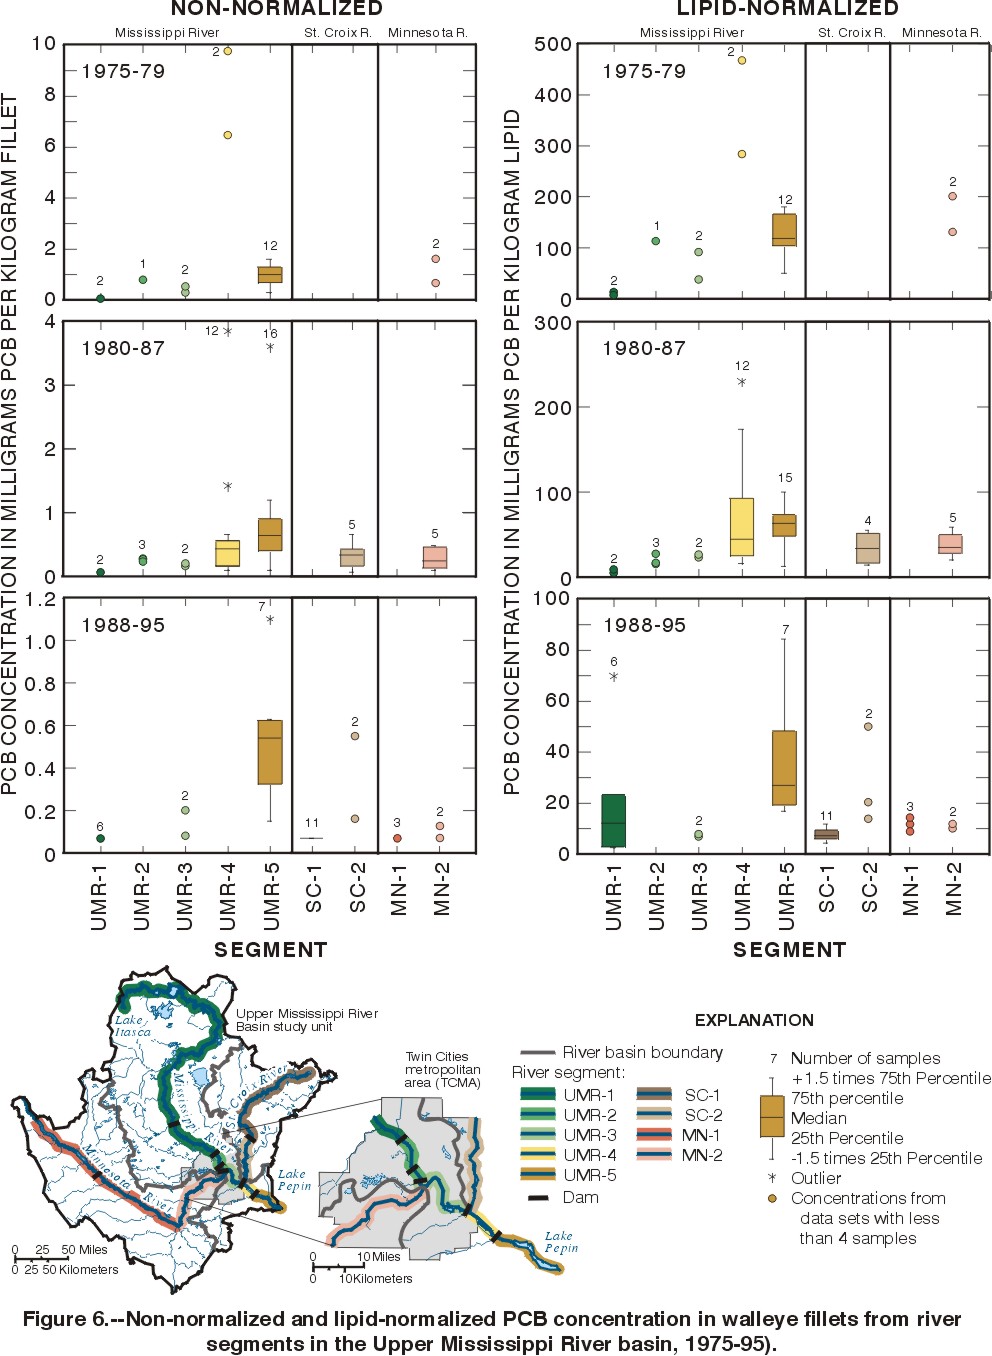
The spatial distribution of PCB concentrations in walleye
is more difficult to determine than for common carp due to smaller data
set sizes. Median PCB concentrations in walleye samples were less than
those of common carp samples in all segments of the Mississippi River during
1975-79 and 1980-87 except UMR-4 during 1975-79 (figs.
5 and 6, tables
4 and 5). Median
non-normalized and LNPCB concentrations in walleye were greatest in UMR-4
during 1975-79, and in UMR-5 during 1980-87 in contrast to PCB concentrations
in common carp, which were greatest in UMR-3 during those time periods.
During 1975-79, MN-2 had a similar median non-normalized and LNPCB concentration
to UMR-2,3 and 5 in the TCMA. During 1980-87, median PCB concentrations
in walleye in SC-2 and MN-2 were similar to those observed in UMR- 2-4
in the TCMA. During 1988-95, median PCB concentrations in walleye were
greater in SC-2 than in SC-1.
Temporal Distribution of Polychlorinated Biphenyls in Common Carp and Walleye in the Mississippi, Minnesota, and St. Croix RiversMedian PCB concentrations
in common carp and walleye at each site on the St. Croix, Minnesota, and
Mississippi Rivers were determined for the three time periods. Upon visual
inspection of figures
3 and 4, median
PCB concentrations in common carp and walleye appear greatest in 1975-79
and 1980-87, and least during 1988-95 at most sites. Declines in median
PCB concentration for common carp at individual sites are most evident
in the TCMA. This trend is not as clear for walleye. The absence of a clear
temporal trend in PCB concentrations for walleye may be attributed to small
data set sizes and the relatively low PCB concentrations in walleye.
There was a significant temporal
decrease in LNPCB concentrations in common carp among the three time periods
within UMR-1,2,3 and 5 and MN-2. There was no difference among time periods
for SC-2 and MN-1, and there were not enough data to determine difference
for UMR-4 and SC-1 (table
4). Median LNPCB concentrations in common carp were highest from 1975-79,
lower during 1980-87, and least from 1988-95 with the exception of SC-2,
which had the greatest median LNPCB concentration during 1980-87, and MN-1
which had a greater LNPCB concentration in 1988-95 than in 1980-87 (table
4, fig. 5). Most
of the stream segments exhibited over 80 percent decline in median PCB
concentrations in common carp between 1975-79 and 1988-95. The percent
change in median LNPCB concentration between 1975-79 and 1988-95 ranged
from a 52 percent decline in the MN-1 to 93 percent decline in UMR-3.
There was a significant decrease
over time of LNPCB concentrations in walleye among time periods at UMR-5,
which was the only segment with a large enough data set size for statistical
analyses. Median non-normalized and LNPCB concentrations were generally
greatest during 1975-79, less during 1980-87, and least during 1988-95,
with the exception of UMR-1 where the medians where greatest during 1988-95,
less in 1975-79, and least during 1980-87. The percent change in median
LNPCB concentration for walleye could be computed for only four river segments.
The values ranged from a 12 percent increase at UMR-1 to a 94 percent decline
at MN-2.
The results from these temporal analyses were similar
to those of other studies in the United States and in the UMIS. In a nationwide
survey, the USFWS (Schmitt and others, 1990) reported a significant downward
trend in PCB concentrations in fish, including concentrations in common
carp at a USFWS station in Lake Pepin between the 1976-77 and the 1984
sampling periods. Sullivan (1988) also reported that PCB concentrations
in common carp tissue decreased 49 percent between the 1975-76 and 1979-80
time periods in the UMIS. Biedron and Helwig (1991) reported a decrease
in concentrations in common carp between a 1975-76 and a 1987-88 sampling
period.
Factors Affecting Polychlorinated Biphenyl DistributionThe spatial distribution of
non-normalized PCB and LNPCB concentrations in common carp and walleye
correspond with historical and current point- and non point-source PCB
inputs in the densely populated TCMA. Moody and Battaglin (1995) reported
that there was more population stress (defined as the number of people
in a drainage basin per river discharge in cubic meter/second) in the Mississippi
(> 10,000) than in the Minnesota (7,500-9,999), or in the St. Croix Rivers
(0-2,499). Greater population density is associated with greater numbers
of electrical transformers, industrial effluent, wastewater sewage inputs,
and runoff from impervious surfaces.
Greater population density
and associated PCB sources could account for greater median and individual
PCB and LNPCB concentrations in fish in the Mississippi River segments
within and downstream of the TCMA (UMR-3,4 and 5) than in fish from sites
upstream of the TCMA. The similarity of PCB and LNPCB concentrations in
common carp and walleye in SC-2 and MN-2 with concentrations in the TCMA
may also be related to greater urbanization. The St. Croix River primarily
drains forested land except in the area below St. Croix Falls where there
is more urbanization and the Minnesota River drains primarily agricultural
land except in the area below Mankato where population density increases.
Other possible reasons for greater PCB concentrations in SC-2 and MN-2
are fish migrations upstream from the Mississippi River.
PCB distribution is also related
to sediment movement and deposition. PCB concentrations in fish were greater
in areas that historically had elevated PCB concentrations in bed sediment
(Degurse and Ruhland, 1972; Interagency Task Force, 1976). Fish in pooled
areas, where they are potentially exposed to greater PCB concentrations
deposited with sediment, exhibit greater concentrations of PCBs in their
tissues. Pooled areas such as Spring Lake (UMR-3) and Lake Pepin (UMR-5)
on the Mississippi River, and Lake St. Croix on the St. Croix River near
its confluence with the Mississippi (part of SC-2) historically had elevated
PCB concentrations in bed sediments (Interagency Task Force, 1976). More
recently, Rostad and others (1995) reported that PCB concentrations in
bed sediment in UMR-2 of the Mississippi River were lower (between 0 and
0.05 mg/kg) than concentrations in UMR-3 and 4 (0.10 to 0.15 mg/kg), and
greatest in UMR-5 (0.20 to 0.30 mg/kg). In addition to factors related
to the environmental setting, other factors such as small data set sizes
and differences in collection and laboratory procedures between agencies
may also influence the observed spatial distribution of PCBs.
Although PCB concentrations have decreased during 1975-95,
low concentrations of PCBs still remain in the aquatic environment despite
the fact that PCBs were banned over 20 years ago. The decrease in PCB concentrations
over the 20 year period evaluated in this report can be attributed to termination
of PCB production and reduction in PCB discharges into these rivers. However,
improvements in laboratory procedures over the 20 year period could also
contribute to a portion of the decrease, because earlier methods may have
overestimated PCB concentrations in the early 1970's (Hora, 1984). PCB
concentrations in walleye decreased more gradually over the 20-year time
period, and were low enough that the variability in the data often masked
any trend. In addition, data set sizes were small, which may influence
the results.
Summary and ConclusionsThe U.S. Geological Survey
(USGS) analyzed previously collected data from 1975-95 on polychlorinated
biphenyl (PCB) concentration data in common carp and walleye fillets in
3 rivers draining the Upper Mississippi River Basin upstream from the outlet
of Lake Pepin. Data were analyzed for the Upper Mississippi River (UMIS)
study unit of the USGS National Water-Quality Assessment Program. The UMIS
study unit is a 47,000-square-mile basin that includes the drainage of
the Mississippi River upstream from Lake Pepin and includes the Twin Cities
Metropolitan Area (TCMA) containing most of the population of Minnesota.
PCB data from common carp and walleye fillets collected from rivers in
the UMIS study unit were obtained from the Metropolitan Council Environmental
Services (MCES), the Minnesota Fish Contaminant Monitoring Program (MFCMP),
the U.S. Fish and Wildlife Service (USFWS), and the Wisconsin Department
of Natural Resources (WDNR).
PCBs in fish tissue are of
concern because PCBs are potentially toxic, teratogenic, and have been
linked to poor fetal development and endocrine disruption in fish and other
animals, including humans, that consume fish. Because of the potential
effects of PCBs on environmental and human health, it is important to develop
strategies of management of PCBs. An understanding of PCB spatial and temporal
trends is necessary to develop these strategies.
During 1975-87 and 1980-87,
10 and 4 percent of walleye samples and 45 and 36 percent of common carp
samples, respectively, exceeded the USFDA guideline of 2 milligrams per
kilogram (mg/kg) PCB in fish tissue. Individual PCB concentrations in common
carp and walleye tissues were below the 2 mg/kg commercial USFDA limit
set for commercial fisheries by the USFDA after 1987.
Median PCB concentrations
at individual sites and within stream segments were generally greatest
in common carp and walleye from Mississippi River segments in the TCMA
during 1975-79 and 1980-87. Median PCB concentrations were generally lower
in walleye than in common carp during 1975-79 and 1980-87 except in river
segment UMR-4 during 1975-79. Median non-normalized and LNPCB concentrations
in walleye were greatest in UMR-4 during 1975-79, and in UMR-5 in 1980-87,
in contrast to PCB concentrations in common carp, which were greatest in
UMR-3 during those time periods.
There was a significant difference
(P < 0.05) among LNPCB concentrations in common carp considering all
river segments combined during all three time periods. Common carp in UMR-3
and 4 in the TCMA had greater LNPCB concentrations than in other river
segments. LNPCB concentrations in common carp and walleye at UMR-1, SC-1
and MN-1 (those segments upstream or outside the TCMA) were lower than
those UMR segments within the TCMA (UMR-2,3,4,5). Median non-normalized
and LNPCB concentrations in common carp in MN-2 and SC-2 were lower than
those in UMR-3, but similar to other UMR segments within and downstream
of the TCMA.
The spatial distribution of
non-normalized PCB and LNPCB concentrations in common carp and walleye
correspond with historical and current point- and non point-source PCB
inputs in the densely populated TCMA. Greater population density and associated
PCB sources could account for greater median and individual PCB and LNPCB
concentrations in fish in the Mississippi River segments within and downstream
of the TCMA (UMR 3,4 and 5) than in fish tissues from sites upstream of
the TCMA. Greater PCB and LNPCB concentrations in common carp and walleye
in SC-2 and MN-2 may also be related to greater urbanization which is associated
with both point- and non point-source PCB contamination. PCB distribution
is also related to sediment movement and deposition. PCB concentrations
in fish were greater in areas that historically had elevated PCB concentrations
in bed sediment. In addition to factors related to the environmental setting,
other factors such as small data set sizes, differences in collection and
laboratory procedures between agencies, and fish migration may also influence
the spatial distribution of PCBs observed in this study.
Temporal trend determination
included graphic analyses of sites and statistical analyses of river segments.
Median PCB concentrations in common carp and walleye at individual sites
were greatest in 1975-79 and 1980-87, and least during 1988-95 at most
sites. Median PCB concentration declines at individual sites are most evident
in the TCMA. There was a significant decrease in LNPCB concentration in
common carp between 1975-79 and 1988-95 in UMR-1,2,3 and 5 and MN-2. Median
LNPCB concentrations in common carp were highest from 1975-79, lower during
1980-87, and least from 1988-95, with the exception of SC-2 which had the
highest median LNPCB concentration during 1980-87, and MN-1 which had a
greater LNPCB concentration during 1988-95 than 1980-87. There was a significant
decrease over time of LNPCB concentrations in walleye among time periods
at UMR-5.
The results from these temporal analyses were similar
to those of other studies in the United States and in Minnesota and Wisconsin
that reported a significant downward trend in PCB concentrations in fish
tissues. Although PCB concentrations have decreased during 1975-95, low
concentrations of PCBs still remain in the aquatic environment despite
the fact that PCBs were banned nearly 20 years ago. The decrease in PCB
concentrations over the 20 year period evaluated can be attributed to termination
of PCB production and reduction in PCB discharges into these rivers. However,
improvements in laboratory procedures over the 20 year period could also
contribute to a portion of the decrease, because earlier methods may have
overestimated PCB concentrations in the early 1970's. PCB concentrations
in walleye decreased more gradually over the 20-year time period, and were
low enough that the variability in the data often masked any trend. In
addition, data set sizes were small, which may influence the results.
ReferencesAnderson, J.P., 1997,
A comparison of temporal trends in ambient and compliance trace element
and PCB data in Pool 2 of the Mississippi River, 1985-95: University of
Minnesota Master's Thesis, 77 p.
Becker, G.C., 1983, Fishes
of Wisconsin: University of Wisconsin Press, Madison, Wisconsin, 1052 p. Biedron, C.J., and Helwig,
D.D., 1991, PCBs in common carp in the Upper Mississippi River: Minnesota
Pollution Control Agency, St. Paul, Minnesota, 41p.
Chapman, P.M., Romberg,
G.P., and Vigers, G.A., 1982, Design and monitoring studies for Priority
Pollutants: Journal of the Water Pollution Control Federation, v. 54, p.
292-297.
Chapman P.M., 1986, Sediment
quality criteria for the sediment quality triad--An example: Environmental
Toxicology and Chemistry, v. 5: p. 957-964.
Colburn, T., and Clement,
C., 1992, Chemically induced alterations in sexual and functional development,
the wildlife/human connection, in Advances in Modern Environmental Toxicology:
Princeton, New Jersey, v. 21, 403 p.
Degurse, P., and Ruhland,
J., 1972, Occurrence of chlorinated biphenyls in Mississippi River fish:
Wisconsin Department of Natural Resources, Bureau of Fish Management, Madison,
Wisconsin, Report No. 52, 13 p.
Dexter, R.N., Hines,
W.G., Quinland E., and Pavlou, S.P., 1978, Dynamics of polychlorinated
biphenyls in the Upper Mississippi River, Task 2--Evaluation of compiled
information: Columbia National Fishery Research Laboratory, U.S. Fish and
Wildlife Service, Columbia Missouri, 65 p.
Durfee, R.L., 1976, Production
and usage of PCBs in the United States--A national conference on polychlorinated
biphenyls: U.S. Environmental Protection Agency Report EPA-56016-75-004,
Washington D.C. p. 103-107.
Eisler, R., 1986, Polychlorinated
biphenyl hazards to fish, wildlife, and invertebrates--A synoptic review:
U.S. Fish and Wildlife Service Biological Report 85, v. 1.7, 72 p.
Gilliom, R.J., Allen,
W.M., and Gurtz, M.E., 1995, Design of the National Water-Quality Assessment
Programs--Occurrence and distribution of water quality conditions: U.S.
Geological Survey Circular 112, 33 p.
Helsel, D.R., 1990, Less
than obvious--Statistical treatment of data below the detection limit:
Environmental Science and Technology, v. 24, p. 1766-1774.
Helsel D.R., and R.M.
Hirsh, 1992, Statistical methods in water resources: Studies in Environmental
Science 49, Elsevier, Amsterdam, 522 p.
Hitt, K.J., 1991, Digital
map file of major land uses in the United States: U.S. Geological Survey,
Reston, Virginia, Scale 1:7,500,000.
Hora, M.E, 1984, Polychlorinated
biphenyl's (PCBs) in common carp ( Cyprinus carpio ) of the Upper
Mississippi River, in Wiener, J.G., Anderson, R.V., and McConville, D.R.,
eds., Contaminants in the Upper Mississippi River--Proceedings of the 15th
annual meeting of the Mississippi River Research Consortium: Butterworth,
Boston, Massachusetts, p. 231-239.
Huckins, J.N., Schwartz,
J.R., and Smith, L.M., 1988, Determination, fate, and potential significance
of PCBs in fish and sediment samples with emphasis on selected AHH-inducing
congeners: Chemosphere, v. 17 no. 10, p. 1995-2016.
Interagency Task Force,
1976, Polychlorinated biphenyls (PCBs) in the Upper Mississippi River Basin:
Minnesota-Wisconsin Interagency Task Force, unpublished report, 55 p.
Jacobson J.L., and Jacobson,
S., 1993, A four year follow-up study of children born to consumers of
Lake Michigan fish: Journal of Great Lakes Research, v. 19, p. 776-783.
Jackson, G.A., Wiener,
J.G., May, T.W., and Ribick, M.A., 1981, Longitudinal distribution of selected
trace elements and organochlorine residues in fish and sediments in the
Upper Mississippi River: Columbia National Fishery Research Laboratory,
U.S. Fish and Wildlife Service, Columbia Missouri, unpublished report,
50 p.
Metropolitan Council,
Environmental Services, 1988, Procedures manual: Water Quality Division,
23 p.
Minnesota Department
of Health, 1998, Minnesota Fish Consumption Advisory: Division of Environmental
Health, St. Paul, Minnesota, 91 p.
Minnesota Department
of Natural Resources, 1994, Minnesota fish contaminant monitoring program,
1990-1992: Data Document, 81 p.
Minnesota Pollution Control
Agency, 1985, Polychlorinated biphenyls (PCBs) in common carp (Cyprinus
carpio) of the upper Mississippi River (1975-1982): Minnesota Pollution
Control Agency, Division of Water Quality, Monitoring and Analyses Section,
Roseville, Minnesota, 27 p.
Minnesota Pollution Control
Agency, Minnesota Department of Natural Resources, and Wisconsin Department
of Natural Resources, 1985, 1982-1984 PCB levels in commercial fish species
of the lower St. Croix and the Mississippi River, Pools 2-10: Joint Report,
18 p.
Moody J.A., and Battaglin,
W.A., 1995, Setting--Chemical character of the Mississippi River, in Meade
R.H. ed., Contaminants in the Mississippi River, 1987-92: U.S. Geological
Survey Circular 1133, p. 31-39.
Rostad, C.E., Bishop,
L.M., Ellis G.S., Leiker, T.J., Monsterleet, S.G., and Pereira, W.E., 1995,
Polychlorinated biphenyls and other synthetic organic contaminants associated
with sediments and fish in the Mississippi River, in Meade R.H. ed., Contaminants
in the Mississippi River, 1987-92: U.S. Geological Survey Circular 1133,
p. 103-113.
Schmitt, C.J., Ribick,
M.A., Ludke, J.L., and May, T.W., 1983, National pesticide monitoring program--Organochlorine
residues in freshwater fish, 1976-79: U.S. Department of the Interior,
Fish and Wildlife Service, Washington, D.C., Resource Publication 152,
62 p.
Schmitt, C.J., Tillitt,
D.E., and Kubiak, T.J., 1996, Biomonitoring of environmental status and
trends (BEST) program--Demonstration of selected aquatic ecosystem indicators
in the Mississippi River system, 1995: June 15, 1996 Status Report, 9 p.
Schmitt, C.J., Zajicek,
J.L., and Peterman P.H., 1990, National Contaminant Biomonitoring Program--Residues
of organochlorine chemicals in U.S. freshwater fish, 1976-1984: Archives
of Environmental Contaminants and Toxicology, v. 19, p. 748-781.
Schneider, R., 1982,
Polychlorinated biphenyls (PCBs) in cod tissues from the western Baltic--Significance
of equilibrium partitioning and lipid composition in the bioaccumulation
of lipophylic pollutants in gill-breathing animals: Merrestorsch, v. 29,
p. 69-79.
Stark, J.R., Andrews,
W.J., Fallon, J.D., Fong, A.L., Goldstein, R.M., Hanson, P.E., Kroening,
S.K., and Lee, K.E., 1996, Water quality assessment of part of the Upper
Mississippi Basin, Minnesota and Wisconsin--Environmental setting and study
design: U.S. Geological Survey Water-Resources Investigations Report 96-4098,
62 p.
Sullivan, J.F., 1988,
A review of the PCB contaminant problem of the Upper Mississippi River
system: Wisconsin Department of Natural Resources, 50 p.
Sullivan, J.F., and Moody,
J.A., 1996, Contaminants in Mississippi River bed sediments collected before
and after the 1993 summer flood in navigation pools 1 to 11: Wisconsin
Department of Natural Resources, USEPA flood assessment grant (water quality)
no. 1995495-01, 50 p.
Steingraeber, M.T., Schwarz,
T.R., Wiener, J.G., and Lebo, J.A., 1994, Polychlorinated biphenyls congeners
in emergent mayflies from the Upper Mississippi River: Environmental Science
and Technology, v. 28, p. 707-714.
Thomas, P., 1989, Effects
of Aroclor 1254 and cadmium on reproductive endocrine function and ovarian
growth in Atlantic croaker: Marine Environmental Research, v. 28, no. 1/4,
p 499-503.
U.S. Environmental Protection
Agency, 1992, National study of chemical residues in fish-Volume II: USEPA
823-r-92-008b, Office of Science and Technology Washington, DC, variously
paged.
U.S. Food and Drug Administration,
1989, Pesticide residues in food and feed- enforcement criteria: Compliance
Policy Guide 7141.10, attachment B.
U.S. Geological Survey,
1990, USGeoData 1:250,000 and 1:100,000 scale land use and land cover maps,
digital data.
Wisconsin Department of
Health and Wisconsin Department of Natural Resources, 1997, Important Health
Information for people eating fish from Wisconsin waters: Pub. no. FH824
97, 51 p.
[Abstract]
[Introduction] [Data
sources and analyses ] [Spatial distribution
of polychlorinated biphenyls in common carp and walleye in the Mississippi,
Minnesota, and St. Croix Rivers] [Temporal
distribution of polychlorinated biphenyls in common carp and walleye in
the Mississippi, Minnesota, and St. Croix Rivers]
[Factors affecting polychlorinated biphenyl distribution]
[Summary and conclusions]
[References]
Note: Polychlorinated
biphenyl (PCB) concentrations in fish fillet tissue are given in units
of milligrams per kilogram (mg/kg). Mg/kg is a unit expressing the concentration
of PCBs in a ratio of one mg of PCBs to 1 kg of tissue. Mg/kg is equivalent
to parts per million (ppm).
Use of product names is for
identification purposes only and does not constitute endorsement by the
U.S. Geological Survey
Information regarding the National
Water Quality Assessment Program (NAWQA) is available on the Internet via
the World Wide Web. You may connect to the NAWQA Home Page using the Universal
Resource Locator (URL) at: http://water.usgs.gov/nawqa/
|
![]() Order USGS maps, products, and publications
Order USGS maps, products, and publications
![]() U.S. Department of the Interior |
U.S. Geological Survey
U.S. Department of the Interior |
U.S. Geological Survey
URL: http://mn.water.usgs.gov/publications/pubs/pcb/pcb.html
Page Contact Information: Webmaster
Page Last Modified: Wednesday, 14-Jan-2009 13:25:10 EST

