Minnesota Water Science Center
CURRENT CONDITIONSCurrent streamflow conditions in Minnesota.
DATA CENTER
USGS IN YOUR STATEUSGS Water Science Centers are located in each state. 
|
Return to Water Resource Annual Data Reports web page Return to Water Year 1998 Annual Report Index web page Water Resources Division of the U.S. Geological Survey (USGS), in cooperation with State agencies, obtains a large amount of data pertaining to the water resources of Minnesota each water year. These data, accumulated during many years, constitute a valuable data base for developing an improved understanding of the water resources of the State. To make these data readily available to interested parties outside the USGS, the data are published annually in this report series entitled "Water Resources Data - Minnesota."
Water-resources data for the 1998 water year (hereinafter 1998) for Minnesota
consist of records of stage, discharge, and water quality of streams; and
stage of lakes and reservoirs; and water quality of ground water. This
volume contains discharge records for 102 stream-gaging stations; stage
for 9 lakes and reservoirs; water quality for 22 stream-gaging stations;
and peak flow data for 87 high-flow partial-record stations. These data
represent a part of the National Water Data System collected by the U.S.
Geological Survey and cooperating State and Federal agencies in Minnesota.
This series of annual reports for Minnesota began with the 1961 water year with a report that contained only data relating to the quantities of surface water. For the 1964 water year, a similar report was introduced that contained only data relating to water quality. Beginning with the 1975 water year, the report was changed to present, in one volume, data on quantities of surface water, quality of surface and ground water, and ground-water levels. Prior to introduction of this series and for several water years concurrent with it, water-resources data for Minnesota were published in U.S. Geological Survey Water-Supply Papers. Data on stream discharge and stage and on lake or reservoir contents and stage, through September 1960, were published annually under the title "Surface-Water Supply of the United States, Parts 4, 5 and 6A." For the 1961 through 1970 water years, the data were published in two 5-year reports. Data on chemical quality, temperature, and suspended sediment for the 1941 through 1970 water years were published annually under the title "Quality of Surface Waters of the United States," and water levels for the 1935 through 1974 water years were published under the title "Ground-Water Levels in the United States." The above mentioned Water-Supply papers can be consulted in the libraries of the principal cities of the United States and may be purchased from the U.S. Geological Survey Branch of Information Services, Federal Center, Box 25286, Denver, Colorado 80225.
Publications similar to this report are published annually by the USGS
for all States. These official Survey reports have an identification number
consisting of the two-letter State abbreviation, the last two digits of
the water year, and volume number. For example, this volume is identified
as the "U.S. Geological Survey Water-Data Report MN-98-1." For archiving
and general distribution, the reports for 1971-74 water years also are
identified as water-data reports. These water-data reports are for sale
in paper copy or in microfiche by the National Technical Information Service,
U.S. Department of Commerce, Springfield, Virginia 22161.
Additional information, including current prices, for ordering specific
reports may be obtained from the District Chief at the address given on
the back of the title page or by telephone (612) 783-3100.
Cooperation
The USGS and agencies of the State of Minnesota have had cooperative agreements
for the systematic collection of streamflow records since 1909, for ground-water
levels since 1948, and for water-quality records since 1952. Organizations
that assisted in collecting data through cooperative agreement with the
Survey are:
-- Minnesota Department of Transportation
-- Minnesota Pollution Control Agency -- Red Lake Watershed Management Board -- Grand Portage Reservation Tribal Council -- Beltrami Soil and Water Conservation District -- Elm Creek Conservation Commission -- Red River Watershed Management Board -- City of Rochester -- Bois Forte Reservation Tribal Council -- Prairie Island Indian Community. Assistance in the form of funds
or services was given by the U.S. Army Corps of Engineers, U.S. Department
of State, and the Federal Energy Regulatory Commission. Other organizations
that supplied data are acknowledged in station descriptions.
Summary of Hydrologic Conditions TopPrecipitation
Most of Minnesota received near normal precipitation ("normal" being the
statistical median based on data from 1961-90) during the 1998 water year
(figs.
1 and 2).
The greatest deviations were 4.7 inches below normal in the northeast,
to 5.0 inches above normal in the southeast. Statewide, the precipitation
totals for the 1998 water year averaged 1.4 inches below normal, or 95
percent of normal.
Precipitation totals for the first quarter, October through December 1997,
ranged from 60 percent of normal in the southeast, to 139 percent of normal
in the northwest, with the statewide average of 80 percent of normal. Most
locales did not experience any snowfall events with greater than 5 inches
of snowfall. By the end of December most reporting stations had less than
6 inches of snow on the ground.
Precipitation for the second quarter was an average of 146 percent above
normal statewide. The southern one-third of the state had the most departure
from normal with the southwest and southeast being 181 percent and 211
percent above normal, respectively. Severe storms toward the end of March
accounted for most of this departure.
The remainder of the year,
April 1 to September 30, saw quarterly precipitation totals near or below
normal throughout the State. June was the only month to have some significant
rainfall totals. One rain event in late June resulted in heavy rainfall
totals, particularly in the southeast, where rainfall totals over 4 inches
were common. Zumbrota reported nearly 8 inches of rain between June 27-28.
Surface Water
Figures
3a
and 3b
show monthly-mean and annual-mean discharges for water year 1998 compared
to normal (median of monthly-mean discharges for the period 1961-90) for
7 streamflow gaging stations. These stations are located in 4 major basins
- Lake Superior, Red River of the North, Lake of the Woods, and the upper
Mississippi River. The 1998 annual-mean discharges were greater than the
normal medians for Red Lake River at Crookston, Chippewa River near Milan,
and Crow River at Rockford; near normal for Mississippi River at Aitkin,
and Des Moines River at Jackson, and below normal for Little Fork River
at Littlefork and Pigeon River at Middle Falls.
Monthly-mean discharges for the Pigeon River at Middle Falls near Grand
Portage were below normal for every month except March, which was 126 percent
of normal. Departures from normal for the remaining months ranged from
99 percent (April) to 21 percent (September) below normal. The annual-mean
discharge for 1998 was 229 ft 3 /s, or 43 percent of normal. Annual
runoff was 5.1 inches, a decrease of 6.3 inches from the previous year.
Above normal monthly-mean discharges occurred every month except April,
at the Red Lake River at Crookston, which is in the Red River of the North
Basin. Flows in April were 62 percent of normal, while flows for the remaining
months ranged from 102 percent of normal in September to 211 percent of
normal in May. Annual runoff for 1998 was 5.07 inches, a decrease of 2.44
inches from the previous year. Annual-mean discharge was 1,968 ft 3
/s, which is 127 percent of normal.
Monthly-mean discharges for the Little Fork River at Littlefork, which
is in the Lake of the Woods basin, began in October at 73 percent of normal
and ended in September at 17 percent of normal. Monthly-mean discharge
was at normal in January and above normal for February and March. The remaining
months were below normal. Annual-mean discharge for 1998 was 606 ft
3 /s, which is 52 percent of normal. Annual runoff for 1998 was 4.90
inches, a decrease of 6.06 inches from the previous year.
Flows in the Mississippi River at Aitkin varied from 138 percent above
normal in October to 35 percent below normal in May and fluctuated above
and below normal the entire water year. The annual-mean discharge of 2,588
ft 3 /s for 1998 is 94 percent of normal and annual runoff was 5.72
inches or 3.98 inches less than last year.
Flows in the Crow River at
Rockford, located about 30 miles west of the Twin Cities in the Mississippi
River Basin, were above normal the entire year and ranged from 107 percent
above normal in September to 572 percent above normal in February. The
annual-mean discharge of 1,202 ft 3 /s for 1998 is 145 percent of
normal. Annual runoff was 6.18 inches, or 3.32 inches less than last year.
In the Chippewa River near
Milan, monthly-mean flows were above normal for the entire year. The month
with the greatest departure from normal was February with a monthly-mean
discharge of 432 ft 3 /s, which is 1,140 percent above normal. The
annual-mean discharge for 1998 was 518 ft 3 /s, which was 170 percent
of normal.
Flows in the Des Moines River
at Jackson in southwest Minnesota fluctuated on both sides of normal throughout
the year. October was the first month since May 1991 with flows below normal
(80 percent of normal). Monthly-mean flows were as low as 54 percent below
normal, in November, and as high as 391 percent above normal in February.
The annual-mean discharge of 256 ft 3 /s for 1998 was 106 percent
of normal.
One station, Cannon River at
Welch, recorded the highest stage for the period of record. The stage of
15.05 feet occurred on June 27th and had a corresponding discharge of 23,500
ft 3 /s, which was the second highest on record. This was a result
of heavy rains in late June (see Precipitation). High Island Creek near
Henderson recorded the second highest discharge of record at 2,410 ft
3 /s on March 29. No other peak flows or minimum flows of record were
noted.
Water Quality
Boxplots for three USGS National Water-Quality Assessment (NAWQA) stations
were used to depict, to a limited extent, variability in concentrations
of dissolved solids and nitrate as nitrogen (figs.
4 and 5).
Boxplots display the central tendency, variation, and skewness of a data
set as well as the presence or absence of extreme values. A boxplot consists
of a centerline (the median) dividing a rectangle whose ends are defined
by the 75th and 25th percentiles. Whiskers extend from the ends of the
box to the most extreme observation within 1.5 times the interquartile
range (the distance from the 25th to the 75th percentile values) beyond
the ends of the box. Values more than 1.5 interquartile ranges from the
box ends may indicate extreme hydrologic and chemical conditions or sampling
and analytical errors. Observations from 1.5 to 3 interquartile ranges
from the box in either direction are plotted individually with a closed
circle. Observations greater than 3 interquartile ranges from the ends
of the box are plotted with an open circle.
Current water year values are plotted with a triangle to show where these
data lie with respect to the distribution of the historic data. These plots
represent each sample collected and were collected monthly, or in some
cases, two to three times per month.
Dissolved-solids sample concentrations
for the Mississippi River near Royalton, Minnesota River near Jordan, and
Mississippi River below Lock and Dam 2 at Hastings were collected for the
Upper Mississippi River NAWQA program, and are shown in figure
4. In 1998, monthly-mean concentrations of dissolved-solids for Mississippi
River at Royalton were at or above the historical median for all months
except December. At the Minnesota River near Jordan, 1998 monthly means
were above the historical monthly medians for the months of November through
March. Samples collected in October, and July through September were below
the median, while April through June had sample results on both sides of
the median. At Mississippi River at Hastings, samples were significantly
above the historical monthly medians for all months except December. In
most months at Hastings the sample results were above the 75th percentile.
Nitrate concentrations reported as nitrogen (analyzed for nitrite plus
nitrate) are shown in figure
5. Sample concentrations in 1998 for the Mississippi River near Royalton
ranged from 0.07 mg/L in August to 0.37 mg/L in March and were above the
historical monthly medians for all months except December, February, April,
June and August. Nitrate concentrations for the Minnesota River near Jordan
ranged generally below the median for the first five months, then above
the median the remaining seven months. Discrete values ranged from 0.05
mg/L in August to 13.0 mg/L in April from 0.13 mg/L in October to 10.3
mg/L in July. Nitrate concentrations for the Mississippi River at Hastings
ranged from 0.85 mg/L in October to 8.35 mg/L in April, which was higher
than historical monthly medians for all months except October, August,
and September.
Special Networks and Programs
Hydrologic Bench-Mark Network is a network of 50 sites in small drainage
basins around the country whose purpose is to provide consistent data on
the hydrology, including water quality, and related factors in representative
undeveloped watersheds nationwide, and to provide analyses on a continuing
basis to compare and contrast conditions observed in basins more obviously
affected by human activities.
National Stream-Quality Accounting Network (NASQAN) monitors the water
quality of large rivers within four of the Nation's largest river basins--the
Mississippi, Columbia, Colorado, and Rio Grande. The network consists of
39 stations. Samples are collected with sufficient frequency that the flux
of a wide range of constituents can be estimated. The objective of NASQAN
is to characterize the water quality of these large rivers by measuring
concentration and mass transport of a wide range of dissolved and suspended
constituents, including nutrients, major ions, dissolved and sediment-bound
heavy metals, common pesticides, and inorganic and organic forms of carbon.
This information will be used (1) to describe the long-term trends and
changes in concentration and transport of these constituents; (2) to test
findings of the NAWQA; (3) to characterize processes unique to large-river
systems such as storage and re-mobilization of sediments and associated
contaminants; and (4) to refine existing estimates of off-continent transport
of water, sediment, and chemicals for assessing human effects on the world's
oceans and for determining global cycles of carbon, nutrients, and other
chemicals.
The National Atmospheric Deposition Program/National Trends Network (NADP/NTN)
provides continuous measurement and assessment of the chemical climate
of precipitation throughout the United States. As the lead Federal agency,
the USGS works together with over 100 organizations to accomplish the following
objectives: (1) Provide a long-term, spatial and temporal record of atmospheric
deposition generated from a network of 191 precipitation chemistry monitoring
sites. (2) Provide the mechanism to evaluate the effectiveness of the significant
reduction in SO2 emissions that began in 1995 as implementation of the
Clean Air Act Amendments (CAAA) occurred. (3) Provide the scientific basis
and nationwide evaluation mechanism for implementation of the Phase II
CAAA emission reductions for SO2 and NOx scheduled to begin in 2000.
Data from the network, as well as information about individual sites, are
available through the World Wide Web at: http://nadp.nrel.colostate.edu/NADP
The National Water-Quality Assessment (NAWQA) Program of the USGS is a
long-term program with goals to describe the status and trends of water-quality
conditions for a large, representative part of the Nation's ground- and
surface-water resources; provide an improved understanding of the primary
natural and human factors affecting these observed conditions and trends;
and provide information that supports development and evaluation of management,
regulatory, and monitoring decisions by other agencies.
Assessment activities are being conducted in 53 study units (major watersheds
and aquifer systems) that represent a wide range of environmental settings
nationwide and that account for a large percentage of the Nation's water
use. A wide array of chemical constituents will be measured in ground water,
surface water, streambed sediments, and fish tissues. The coordinated application
of comparative hydrologic studies at a wide range of spatial and temporal
scales will provide information for decision making by water-resources
managers and a foundation for aggregation and comparison of findings to
address water-quality issues of regional and national interest.
Communication and coordination between USGS personnel and other local,
State, and Federal interests are critical components of the NAWQA. Each
study unit has a local liaison committee consisting of representatives
from key Federal, State, and local water resources agencies, Indian nations,
and universities in the study unit. Liaison committees typically meet semiannually
to discuss their information needs, monitoring plans and progress, desired
information products, and opportunities to collaborate efforts among the
agencies.
Additional information about NAWQA is available through the World Wide
Web at: http://wwwrvares.er.usgs.gov/nawqa/nawqa_home.html
Explanation of the RecordsThe surface-water and ground-water
records published in this report are for the 1998 water year that began
October 1, 1997, and ended September 30, 1998. A calendar of the water
year is provided on the inside of the front cover. The records contain
streamflow data, stage and content data for lakes and reservoirs, water-quality
data for the surface and ground water, and ground-water-level data. The
following sections of the introductory text are presented to provide users
with a more detailed explanation of how the hydrologic data published in
this report were collected, analyzed, computed, and arranged for presentation.
Station Identification Numbers
Each data station, whether stream site or well, in this report is assigned
a unique identification number. This number is unique in that it applies
specifically to a given station. The number usually is assigned when a
station is first established and is retained for that station indefinitely.
The system used by the USGS to assign identification numbers for surface-water
stations and for ground-water well sites differ, but both are based on
geographic location. The "downstream order" system is used for regular
surface-water stations and the "latitude-longitude" system is used for
wells and, in Minnesota, for surface-water stations where only miscellaneous
measurements are made.
Downstream Order System and Station Number
Since October 1, 1950, the order of listing hydrologic-station records
in USGS reports is in a downstream direction along the main stream. All
stations on a tributary entering upstream from a main stream station are
listed before that station. A station on a tributary that enters between
two main-stream sections is listed between them. A similar order is followed
by listing stations on first rank, second rank, and other order ranks of
tributaries. The rank of any tributary on which a station is situated with
respect to the stream to which it is immediately tributary is indicated
by an indentation in a list of stations in front of the report. Each indention
represents one rank. This downstream order and system of indention show
which stations are on tributaries between any two stations and the rank
of the tributary on which each station is situated.
As an added means of identification, each hydrologic station and partial-record
station has been assigned a station number. These are in the same downstream
order in this report. In assigning station numbers, no distinction is made
between partial-record stations and other stations; therefore, the station
number for a partial-record station indicates downstream-order position
in a list made up of both types of stations. Gaps are left in the series
of numbers to allow for new stations that may be established; hence, the
numbers are not consecutive. The complete eight-digit number for each station
such as 05041000, which appears just to the left of the station name, includes
the two-digit part number "05" plus the six-digit downstream order number
"041000."
Numbering System for Wells and Miscellaneous Sites
The eight-digit downstream order station numbers are not assigned to wells
and miscellaneous sites where only random water-quality samples or discharge
measurements are taken.
The well and miscellaneous site numbering system of the USGS is based on
the grid system of latitude and longitude. The system provides the geographic
location of the well or miscellaneous site and a unique number for each
site. The number consists of 15 digits. The first six digits denote the
degrees, minutes, and seconds of latitude, the next seven digits denote
degrees, minutes, and seconds of longitude, and the last two digits (assigned
sequentially) identify the wells or other sites within a one-second grid.
See figure
6. Each well site is also identified by a local well number, which
consists of township, range, and section numbers, three letters designating
1/4, 1/4, 1/4 section location, and a two-digit sequential number.
Records of Stage and Water Discharge Top
Records of stage and water discharge may be complete or partial. Complete
records of discharge are those obtained using a continuous stage-recording
device through which either instantaneous or mean- daily discharge may
be computed for anytime, or any period of time, during the period of record.
Complete records of lake or reservoir content, similarly, are those for
which stage or content may be computed or estimated with reasonable accuracy
for any time, or period of time. They may be obtained using a continuous
stage-recording device, but need not be. Because daily-mean discharges
and end-of-day contents commonly are published for such stations, they
are referred to as "daily stations."
By contrast, partial records are obtained through discrete measurements
without using a continuous stage-recording device and pertain only to a
few flow characteristics, or perhaps only one. The nature of the partial
record is indicated by table titles such as "High-flow partial records,"
or "Low-flow partial records." Records of miscellaneous discharge measurements
or of measurements from special studies, such as low-flow seepage studies,
may be considered as partial records, but they are presented separately
in this report. Location of all continuous-record and high-flow partial-record
stations for which data are given in this report are shown in figures
7 and 8.
Data Collection and Computation
The data obtained at a complete-record gaging station on a stream or canal
consist of a continuous record of stage, individual measurements of discharge
throughout a range of stages, and notations regarding factors that may
affect the relations between stage and discharge. These data, together
with supplemental information, such as weather records, are used to compute
daily discharges. The data obtained at a complete-record gaging station
on a lake or reservoir consist of a record of stage and of notations regarding
factors that may affect the relation between stage and lake content. These
data are used with stage-area and stage-capacity curves or tables to compute
water-surface areas and lake storage.
Records of stage are obtained with recorders that trace continuous graphs
of stage or encode stage values at selected time intervals and store on
a variety of media. Measurements of discharge are made with current meters
using methods adapted by the USGS as a result of experience accumulated
since 1880. These methods are described in standard textbooks, in U.S.
Geological Survey Water-Supply Paper 2175, and in U.S. Geological Survey
Techniques of Water-Resources Investigations (TWRI), book 3, chapter A6.
In computing discharge records, results of individual measurements are
plotted against the corresponding stages, and stage-discharge relation
curves are then constructed. From these curves, rating tables indicating
the approximate discharge for any stage within the range of the measurements
are prepared. If it is necessary to define extremes of discharge outside
the range of current-meter measurements, the curves are extended using:
(1) logarithmic-plotting; (2) velocity-area studies; (3) results of indirect
measurements of peak discharge, such as slope-area or contracted-opening
measurements, and computations of flow-over-dams or weirs; or (4) step-backwater
techniques.
Daily-mean discharges are computed by applying the daily-mean stages (gage
heights) to the stage-discharge curves or tables. If the stage-discharge
relation is subject to change because of frequent or continual change in
the physical features that form the control, the daily-mean discharge is
determined by the shifting-control method, in which correction factors
based on the individual discharge measurements and notes of the personnel
making the measurements are applied to the gage heights before the discharges
are determined from the curves or tables. This shifting-control method
also is used if the stage-discharge relation is changed temporarily because
of aquatic growth or debris on the control. For some stations, formation
of ice in the winter may so obscure the stage-discharge relations that
daily-mean discharges must be estimated from other information such as
temperature and precipitation records, notes of observations, and records
for other stations in the same or nearby basins for comparable periods.
At some stream-gaging stations the stage-discharge relation is affected
by the backwater from reservoirs, tributary streams, or other sources.
This necessitates the use of the slope method in which the slope or fall
in a reach of the stream is a factor in computing discharge. The slope
or fall is obtained by means of an auxiliary gage set at some distance
from the base gage. At some stations the stage-discharge relation is affected
by changing stage. At these stations the rate of change in stage is used
as a factor in computing discharge.
In computing records of lake or reservoir contents, it is necessary to
have available from surveys, curves, or tables defining the relation of
stage and content. The application of stage to the stage-content curves
or tables gives the contents from which daily, monthly, or yearly changes
then are determined. If the stage-content relation changes because of deposition
of sediment in a lake or reservoir, periodic resurveys may be necessary
to redefine the relation. Even when this is done, the contents computed
may become increasingly in error as time since the last survey increases.
Discharge over lake or reservoir spillways are computed from stage-discharge
relations much as other stream discharges are computed.
For some gaging stations there are periods when no gage-height record is
obtained, or the recorded gage height is so faulty that it cannot be used
to compute daily discharge or contents. For such periods, the daily discharges
are estimated from the recorded range in stage, previous or following record,
discharge measurements, weather records, and comparison with other station
records from the same or nearby basins. Likewise, daily contents may be
estimated from operator's logs, previous or following record, inflow-outflow
studies, and other information. Information explaining how estimated daily-discharge
values are identified in station records is included in the next two sections,
"Data Presentation" (REMARKS paragraph) and "Identifying Estimated Daily
Discharge."
Data Presentation
Streamflow data in this report are presented in a new format that is considerably
different from the format in data reports prior to the 1991 water year.
The major changes are that statistical characteristics of discharge now
appear in tabular summaries following the water-year data table and less
information is provided in the text or station manuscript above the table.
These changes represent the results of a pilot program to reformat the
annual water-data report to meet current user needs and data preferences.
The records published for each continuous-record surface-water discharge
station (gaging station) now consist of four parts: the manuscript or station
description; the data table of daily-mean values of discharge for the current
water year with summary data; a tabular statistical summary of monthly-mean-flow
data for a designated period, by water year; and a summary statistics table
that includes statistical data of annual, daily and instantaneous flows
as well as data pertaining to annual runoff, 7-day low-flow minimums, and
flow duration.
Station Manuscript Top
The manuscript provides, under various headings, descriptive information,
such as station location, period of record, historical extremes outside
the period of record, record accuracy, and other remarks pertinent to station
operation and regulation. The following information, as appropriate, is
provided with each continuous record of discharge or lake content. Comments
to follow clarify information presented under the various headings of the
station description.
LOCATION-- Information
on locations is obtained from the most accurate maps available. The location
of the gage with respect to the cultural and physical features in the vicinity
and with respect to the reference place mentioned in the station name is
given. River mileages, given for only a few stations, were determined by
methods given in "River Mileage Measurement," Bulletin 14, Revision of
October 1968, prepared by the Water Resources Council or were provided
by the U.S. Army Corps of Engineers.
DRAINAGE AREA-- Drainage
areas are measured using the most accurate maps available. Because the
type of maps available varies from one drainage basin to another, the accuracy
of drainage areas likewise varies. Drainage areas are updated as better
maps become available.
PERIOD OF RECORD-- This
indicates the period for which there are published records for the station
or for an equivalent station. An equivalent station is one that was in
operation at a time when the present station was not, and whose location
was such that records from it can reasonably be considered equivalent with
records from the present station.
REVISED RECORDS-- Published
records, because of new information, occasionally are found to be incorrect,
and revisions are printed in later reports. Listed under this heading are
all reports in which revisions have been published for the station and
water years to which the revisions apply. If a revision did not include
daily, monthly, or annual figures of discharge, that fact is noted after
the year dates as follows: "(M)" means that only the instantaneous maximum
discharge was revised; "(m)" means that only the instantaneous minimum
was revised; and "(P)" means that only peak discharges were revised. If
the drainage area has been revised, the report in which the most recently
revised figure was first published is given.
GAGE-- The type of gage
in current use, the datum of the current gage referred to National Geodetic
Vertical Datum of 1929 (see glossary), and a condensed history of the types,
locations, and datum of previous gages are given under this heading.
REMARKS-- All periods
of estimated daily-discharge record will either be identified by date in
this paragraph of the station description for water-discharge stations
or flagged in the daily-discharge table. If a remarks statement is used
to identify estimated record, the paragraph will begin with this information
presented as the first entry. The paragraph is also used to present information
relative to the accuracy of the records, to special methods of computation,
to conditions that affect natural flow at the station and, possibly, to
other pertinent items. For reservoir stations, information is given on
the dam forming the reservoir, the capacity, outlet works and spillway,
and purpose and use of the reservoir.
COOPERATION-- Records
provided by a cooperating organization or obtained for the USGS by a cooperating
organization are identified here.
EXTREMES OUTSIDE PERIOD
OF RECORD-- Included here is the information concerning major floods
or unusually low flows that occurred outside the stated period of record.
The information may or may not have been obtained by the USGS.
REVISIONS-- If a critical
error in published records is discovered, a revision is included in the
first report published following discovery of the error.
Although rare, occasionally the records of a discontinued gaging station
may need revision. Because, for these stations, there would be no current
or, possibly, future station manuscript published to document the revision
in a "Revised Records" entry, users of data for these stations who obtained
the record from previously published data reports may wish to contact the
Minnesota District office (address given on the back of title page of this
report) to determine if the published records were ever revised after the
station was discontinued. Of course, if the data were obtained by computer
retrieval, the data would be current and there would be no need to check
because any published revision of data is always accompanied by revision
of the corresponding data in computer storage.
Manuscript information for lake or reservoir stations differs from that
for stream stations in the nature of the "Remarks" and to the inclusion
of a skeleton stage-capacity table when daily contents are given.
Headings for AVERAGE DISCHARGE, EXTREMES FOR PERIOD OF RECORD, AND EXTREMES
FOR CURRENT YEAR have been deleted and the information contained in these
paragraphs, except for the listing of secondary instantaneous peak discharges
in the EXTREMES FOR CURRENT YEAR paragraph, is now presented in the tabular
summaries following the discharge table or in the REMARKS paragraph, as
appropriate. No changes have been made to the data presentations of lake
contents.
Peak Discharges Greater Than Base Discharge
Tables of peak discharges above base discharge are included for some stations
where secondary instantaneous peak discharges are used in flood-frequency
studies of highway and bridge design, flood control structures, and other
flood related projects. The base discharge value is selected so an average of
three peaks a year will be reported. This base discharge value has a recurrence
interval of approximately 1.1 years.
Data Table of Daily-Mean Values
The daily table of discharge records for stream-gaging stations gives mean
discharge for each day of the water year. In the monthly summary for the
table, the line headed TOTAL gives the sum of the daily figures for each
month; the line headed MEAN gives the average flow in cubic feet per second
for the month; and the lines headed MAX and MIN give the maximum and minimum
daily-mean discharges, respectively, for each month. Discharge for the
month also is usually expressed in cubic feet per second per square mile
(line headed CFSM); or in inches (line headed IN); or in acre-feet (line
headed AC-FT). Figures for cubic feet per second per square mile and runoff
in inches or in acre-feet may be omitted if there is extensive regulation
or diversion or if the drainage area includes large noncontributing areas.
At some stations, monthly and (or) yearly observed discharges are adjusted
for reservoir storage or diversion, or diversion data or reservoir contents
are given. These figures are identified by a symbol and corresponding footnote.
Statistics of Monthly-Mean Data
A tabular summary of the mean (line headed MEAN), maximum (line headed
MAX), and minimum (line headed MIN) of monthly-mean flows for each month
for a designated period is provided below the mean values table. The water
years of the first occurrence of the maximum and minimum monthly flows
are provided immediately below those figures. The designated period will
be expressed as FOR WATER YEARS 19__-19__, BY WATER YEAR (WY), and will
list the first and last water years of the range of years selected from
the PERIOD OF RECORD paragraph in the station manuscript. It will consist
of all of the station record within the specified water years, inclusive,
including complete months of record for partial water years, if any, and
may coincide with the period of record for the station. The water years
for which the statistics are computed will be consecutive, unless a break
in the station record is indicated in the manuscript.
Summary Statistics
A table titled SUMMARY STATISTICS follows the statistics of monthly mean
data tabulation. This table consists of four columns, with the first column
containing the line headings of the statistics being reported. The table
provides a statistical summary of yearly, daily, and instantaneous flows,
not only for the current water year but also for the previous calendar
year and for a designated period, as appropriate. The designated period
selected, WATER YEARS 19__-19__, will consist of all of the station record
within the specified water years, inclusive, including complete months
of record for partial water years, if any, and may coincide with the period
of record for the station. The water years for which the statistics are
computed will be consecutive, unless a break in the station record is indicated
in the manuscript. All of the calculations for the statistical characteristics
designated ANNUAL (see line headings below), except for the ANNUAL 7-DAY
MINIMUM statistic, are calculated for the designated period using complete
water years. The other statistical characteristics may be calculated using
partial water years.
The date or water year, as appropriate, of the first occurrence of each
statistic reporting extreme values of discharge is provided adjacent to
the statistic. Repeated occurrences may be noted in the REMARKS paragraph
of the manuscript or in footnotes. Because the designated period may not
be the same as the station period of record published in the manuscript,
occasionally the dates of occurrence listed for the daily and instantaneous
extremes in the designated-period column may not be within the selected
water years listed in the heading. When this occurs, it will be noted in
the REMARKS paragraph or in footnotes. Selected streamflow duration curve
statistics and runoff data are also given. Runoff data may be omitted if
there is extensive regulation or diversion of flow in the drainage basin.
The following summary statistics data, as appropriate, are provided with
each continuous record of discharge. Comments to follow clarify information
presented under the various line headings of the summary statistics table.
ANNUAL TOTAL-- The sum
of the daily-mean values of discharge for the year. At some stations the
yearly-mean discharge is adjusted for reservoir storage or diversion. The
adjusted figures are identified by symbol and corresponding footnotes.
ANNUAL MEAN-- The arithmetic
mean of the individual daily-mean discharges for the year noted or for
the designated period. At some stations the yearly-mean discharge is adjusted
for reservoir storage or diversion. The adjusted figures are identified
by a symbol and corresponding footnotes.
ANNUAL 7-DAY MINIMUM--
The lowest mean discharge for 7 consecutive days for a calendar year or
a water year. Note that most low-flow frequency analyses of annual 7- day
minimum flows use a climatic year (April 1-March 31). The date shown in
the summary statistics table is the initial date of the 7-day period. (This
value should not be confused with the 7-day 10-year low-flow statistic.)
INSTANTANEOUS PEAK FLOW--
The maximum instantaneous discharge occurring for the water year or for
the designated period. Note that secondary instantaneous peak discharges
above a selected base discharge are stored in Minnesota District computer
files for stations meeting certain criteria. Those discharge values may
be obtained by writing to the Minnesota District Office. (See address on
back of title page of this report.)
INSTANTANEOUS PEAK STAGE--
The maximum instantaneous stage occurring for the water year or for the
designated period. If the dates of occurrence for the instantaneous peak
flow and instantaneous peak stage differ, the REMARKS paragraph in the
manuscript or a footnote may be used to provide further information.
INSTANTANEOUS LOW FLOW--
The minimum instantaneous discharge occurring for the water year or for
the designated period.
ANNUAL RUNOFF-- Indicates
the total quantity of water in runoff for a drainage area for the year.
Data reports may use any of the following units of measurement in presenting
annual runoff data.
Acre-foot (AC-FT)
is the quantity of water required to cover 1 acre to a depth of 1 foot
and is equivalent to 43,560 cubic feet or about 326,000 gallons or 1,233
cubic meters.
Cubic feet per second
per square mile (CFSM) is the average number of cubic feet of water
flowing per second from each square mile of area drained, assuming the
runoff is distributed uniformly in time and area.
Inches (INCHES)
indicates the depth to which the drainage area would be covered if all
of the runoff for a given time period were uniformly distributed on it.
10 PERCENT EXCEEDS--
The discharge that is exceeded by 10 percent of the flow for the designated
period.
50 PERCENT EXCEEDS--
The discharge that is exceeded by 50 percent of the flow for the designated
period.
90 PERCENT EXCEEDS--
The discharge that is exceeded by 90 percent of the flow for the designated
period.
Data collected at partial-record stations follow the information for continuous-record
sites. Data for partial-record discharge stations are presented in two
tables. The first is a table of discharge measurements at low-flow partial-record
stations, and the second is a table of annual maximum stage and discharge
at crest-stage stations. The tables of partial-record stations are followed
by a listing of discharge measurements made at sites other than continuous-record
or partial-record stations. These measurements are generally made in times
of drought or flood to give better areal coverage to those events. Those
measurements and others collected for some special reason are called measurements
at miscellaneous sites.
Identifying Estimated Daily Discharge
Estimated daily-discharge values published in the water-discharge tables
of annual State data reports are identified either by flagging individual
daily values with the letter symbol "e" and printing a table footnote,
"e Estimated," or by listing the dates of the estimated record in the REMARKS
paragraph of the station description.
Accuracy of the Records
The accuracy of streamflow records depends primarily on: (1) The stability
of the stage-discharge relation or, if the control is unstable, the frequency
of discharge measurements; and (2) the accuracy of measurements of stage,
measurements of discharge, and interpretation of records.
The accuracy attributed to the records is indicated under REMARKS. "Excellent"
means that about 95 percent of the daily discharges are within 5 percent
of the true; "good," within 10 percent; and "fair," within 15 percent.
Records that do not meet the criteria mentioned are rated "poor." Different
accuracies may be attributed to different parts of a given record.
Daily-mean discharges in this report are given to the nearest hundredth
of a cubic foot per second for values less than 1 ft 3 /s; to the
nearest tenth between 1.0 and 10 ft 3 /s; to whole numbers between
10 and 1,000 ft 3 /s; and to 3 significant figures for more than
1,000 ft 3 /s. The number of significant figures used is based solely
on the magnitude of the discharge value. The same rounding rules apply
to discharges listed for partial-record stations and miscellaneous sites.
Discharge at many stations, as indicated by the monthly mean, may not reflect
natural runoff due to the effects of diversion, consumption, regulation
by storage, increase or decrease in evaporation due to artificial causes,
or to other factors. For such stations, figures of cubic feet per second
per square mile and of runoff, in inches, are not published unless satisfactory
adjustments can be made for diversions, for changes in contents of reservoirs,
or for other changes incident to use and control. Evaporation from a reservoir
is not included in the adjustments for changes in reservoir contents, unless
it is so stated. Even at those stations where adjustments are made, large
errors in computed runoff may occur if adjustments or losses are large
in comparison with the observed discharge
Other Records Available
Information of a more detailed nature than that published for most of the
gaging stations, such as observations of water temperatures, discharge
measurements, gage-height records, and rating tables, is on file in the
Minnesota District office. Also most gaging-station records are available
in computer-usable form and many statistical analyses have been made.
Information on the availability of unpublished data or statistical analyses
may be obtained from the district office.
The National Water Data Exchange, Water Resources Division, U.S. Geological
Survey, National Center, Reston, VA 22092, maintains an index of all discharge-measurement
sites in the State as well as an index of records of discharge collected
by other agencies but not published by the USGS. Information on records
available at specific sites can be obtained upon request.
Records of Surface-Water Quality Top
Records of surface-water quality ordinarily are obtained at or near stream-gaging
stations because interpretation of records of surface-water quality nearly
always requires corresponding discharge data. Records of surface-water
quality in this report may involve a variety of types of data and measurement
frequencies.
Classification of Records
Water-quality data for surface-water sites are grouped into one of three
classifications. A continuing record station is a site where data are collected
on a regularly scheduled basis. Frequency may be one or more times daily,
weekly, monthly, or quarterly. A partial-record station is a site where
limited water-quality data are collected systematically over a period of
years. Frequency of sampling is usually less than quarterly. A miscellaneous
sampling site is a location other than a continuing or partial-record station,
where random samples are collected to give better areal coverage to define
water-quality conditions in the river basin.
A distinction needs to be made between "continuing records," as used in
this report, and "continuous recordings," which refers to a continuous
graph or a series of discrete values punched at short intervals on a paper
tape. Some records of water quality, such as temperature and specific conductance,
may be obtained through continuous recordings; however, most data are obtained
only monthly or less frequently.
Arrangement of Records
Water-quality records collected at a surface-water daily record station
are published immediately following that record, regardless of the frequency
of sample collection. Station number and name are the same for both records.
Where a surface-water daily-record station is not available or where the
water quality differs significantly from that at the nearby surface-water
station, the continuing water-quality record is published with its own
station number and name in the regular downstream-order sequence. Water-quality
data for partial-record stations and for miscellaneous sampling sites appear
in separate tables following the table of discharge measurements at miscellaneous
sites.
On-Site Measurement and Sample Collection
Water-quality data must be representative of the in situ quality of water.
To assure this, certain measurements, such as water temperature, pH, and
dissolved oxygen, need to be made onsite when the samples are taken. To
assure that measurements made in the laboratory also represent the in situ
water, carefully prescribed procedures need to be followed in collecting
the samples, in treating the samples to prevent changes in quality pending
analysis, and in shipping the samples to the laboratory. Procedures for
on-site measurements and for collecting, treating, and shipping samples
are given in publications on U.S. Geological Survey Techniques of Water-Resources
Investigations, book 1, chap. D2; book 3, chap. C2; book 5 chaps. A1, A3,
and A4. All of these references are listed on pages 22-24 of this report.
Also, detailed information on collecting, treating, and shipping samples
may be obtained from the USGS Minnesota District office.
One sample can define adequately the water quality at a given time if the
mixture of solutes throughout the stream cross section is homogeneous.
However, the concentration of solutes at different locations in the cross
section may vary widely with different rates of water discharge, depending
on the source of material and the turbulence and mixing of the stream.
Some streams must be sampled through several vertical sections to obtain
a representative sample needed for an accurate mean concentration and for
use in calculating load. All samples obtained for the National Stream Quality
Accounting Network (see definitions) are obtained from at least several
verticals. Whether samples are obtained from the centroid of flow or from
several verticals depends on flow conditions and other factors which must
be evaluated by the collector.
Chemical-quality data published in this report are considered to be the
most representative values available for the stations listed. The values
reported represent water-quality conditions at the time of sampling as
much as possible, consistent with available sampling techniques and methods
of analysis. In the rare case where an apparent inconsistency exists between
a reported pH value and the relative abundance of carbon dioxide species
(carbonate and bicarbonate), the inconsistency is the result of a slight
uptake of carbon dioxide from the air by the sample between measurement
of pH in the field and determination of carbonate and bicarbonate in the
laboratory.
For chemical-quality stations equipped with digital monitors, the records
consist of daily maximum, minimum, and mean values for each constituent
measured and are based upon hourly punches beginning at 0100 hours and
ending at 2400 hours for the day of record. More detailed records (hourly
values) may be obtained from the USGS Minnesota District office.
Water Temperature
Water temperatures are measured at most of the water-quality stations.
In addition, water temperatures are taken at time of discharge measurements
for water-discharge stations. For stations where water temperatures are
taken manually once or twice daily, the water temperatures are taken at
about the same time each day. Large streams have a small diurnal temperature
change; shallow streams may have a daily range of several degrees and may
follow
closely the changes in air temperature. Some streams may be affected by
waste-heat discharges.
At stations where recording instruments are used, either mean temperatures
or maximum and minimum temperatures for each day are published. Water temperatures
measured at the time of water-discharge measurements are on file in the
Minnesota District office.
Sediment
Suspended-sediment concentrations are determined from samples collected
by using depth-integrating samplers. Samples usually are obtained at several
verticals in the cross section, or a single sample may be obtained at a
fixed point and a coefficient applied to determine the mean concentration
in the cross sections.
During periods of rapidly changing flow or rapidly changing concentration,
samples may have been collected more frequently (twice daily or, in some
instances, hourly). The published sediment discharges for days of rapidly
changing flow or concentration were computed by the subdivided-day method
(time-discharge weighted average). Therefore, for those days when the published
sediment discharge value differs from the value computed as the product
of discharge times mean concentration times 0.0027, the reader can assume
that the sediment discharge for that day was computed by the subdivided-day
method. For periods when no samples were collected, daily loads of suspended
sediment were estimated on the basis of water discharge, sediment concentrations
observed immediately before and after the periods, and suspended-sediment
loads for other periods of similar discharge.
At other stations, suspended-sediment samples were collected periodically
at many verticals in the stream cross section. Although data collected
periodically may represent conditions only at the time of observations,
such data are useful in establishing seasonal relations between quality
and streamflow and in predicting long-term sediment-discharge characteristics
of the stream.
In addition to the records of suspended-sediment discharge, records of
the periodic measurements of the particle-size distribution of the suspended
sediment and bed material are included for some stations.
Laboratory Measurements Top
Samples for indicator bacteria and specific conductance are analyzed locally.
All other samples are analyzed in the Geological Survey laboratories in
Arvada, Colorado, Doraville, Georgia, or Iowa City, Iowa. Methods used
in analyzing sediment samples and computing sediment records are given
in U.S. Geological Survey Techniques of Water Resources Investigations,
book 5, chap. C1. Methods used by the USGS laboratories are given in U.S.
Geological Survey Techniques of Water Resources Investigation, book 1,
chap. D2; book 3, chap. C2; book 5, chaps. A1, A3, and A4.
Data Presentation
For continuous-record stations, information pertinent to the history of
station operation is provided in descriptive headings preceding the tabular
data. These descriptive headings give details regarding location, drainage
area, period of record, type of data available, instrumentation, general
remarks, cooperation, and extremes for parameters currently measured daily.
Tables of chemical, physical, biological, radiochemical data, and so forth,
obtained at a frequency less than daily are presented first. Tables of
daily values of specific conductance, pH, water temperature, dissolved,
and suspended sediment then follow in sequence.
In the descriptive headings, if the location is identical to that of the
discharge gaging station, neither the LOCATION nor the DRAINAGE AREA statements
are repeated. The following information, when appropriate, is provided
with each continuous-record station. Comments that follow clarify information
presented under the various headings of the station description.
LOCATION-- See "Data
Presentation" under "Records of Stage and Water Discharge;" same comments
apply.
DRAINAGE AREA-- See
"Data Presentation" under "Records of Stage and Water Discharge;" same
comments apply.
PERIOD OF RECORD-- This
indicates the periods for which there are published water-quality records
for the station. The periods are shown separately for records of parameters
measured daily or continuously and those measured less than daily. For
those measured daily or continuously, periods of record are given for the
parameters individually.
INSTRUMENTATION-- Information
on instrumentation is given only if a water-quality monitor, temperature
recorder, sediment pumping sampler, or other sampling device is in operation
at a station.
REMARKS-- Remarks provide
added information pertinent to the collection, analysis, or computation
of the records.
COOPERATION-- Records
provided by a cooperating organization or obtained for the USGS by a cooperating
organization are identified here.
EXTREMES-- Maximums
and minimums are given only for parameters measured daily or more frequently.
None are given for parameters measured weekly or less frequently, because
the true maximums or minimums may not have been sampled. Extremes, when
given, are provided for both the period of record and for the current water
year.
REVISIONS-- If errors
in published water-quality records are discovered after publication, appropriate
updates are made to the Water-Quality File in the U.S. Geological Survey's
computerized data system, WATSTORE, and subsequently by monthly transfer
of update transactions to the U.S. Environmental Protection Agency's STORET
system. Because the usual volume of updates makes it impractical to document
individual changes in the State data-report series or elsewhere, potential
users of USGS water-quality data are encouraged to obtain all required
data from the appropriate computer file to ensure the most recent updates.
The surface-water-quality records for partial-record stations and miscellaneous
sampling sites are published in separate tables following the table of
discharge measurements at miscellaneous sites. No descriptive statements
are given for these records. Each station is published with its own station
number and name in the regular downstream-order sequence.
Remark Codes Top
Data generated from quality-control (QC) samples are a requisite for evaluating
the quality of the sampling and processing techniques as well as data from
the actual samples themselves. Without QC data, environmental sample data
cannot be adequately interpreted because the errors associated with the
sample data are unknown. The various types of QC samples collected by this
district are described in the following section. Procedures have been established
for the storage of water-quality-control data within the USGS. These procedures
allow for storage of all derived QC data and are identified so that they
can be related to corresponding environmental samples.
Blank Samples
Blank samples are collected and analyzed to ensure that environmental samples
have not been contaminated by the overall data-collection process. The
blank solution used to develop specific types of blank samples is a solution
that is free of the analytes of interest. Any measured value signal in
a blank sample for an analyte (a specific component measured in a chemical
analysis) that was absent in the blank solution is believed to be due to
contamination. There are many types of blank samples possible, each designed
to segregate a different part of the overall data-collection process. The
types of blank samples collected in this district are:
FIELD BLANK-- a blank
solution that is subjected to all aspects of sample collection, field processing
preservation, transportation, and laboratory handling as an environmental
sample.
TRIP BLANK-- a blank
solution that is put in the same type of bottle used for an environmental
sample and kept with the set of sample bottles before and after sample
collection.
EQUIPMENT BLANK-- a
blank solution that is processed through all equipment used for collecting
and processing an environmental sample (similar to a field blank but normally
done in the more controlled conditions of the office).
SAMPLER BLANK-- a blank
solution that is poured or pumped through the same field sampler used for
collecting an environmental sample.
FILTER BLANK-- a blank
solution that is filtered in the same manner and through the same filter
apparatus used for an environmental sample.
SPLITTER BLANK-- a blank
solution that is mixed and separated using a field splitter in the same
manner and through the same apparatus used for an environmental sample.
PRESERVATION BLANK--
a blank solution that is treated with the sampler preservatives used for
an environmental sample.
Reference Samples
Reference material is a solution or material prepared by a laboratory whose
composition is certified for one or more properties so that it can be used
to assess a measurement method. Samples of reference material are submitted
for analysis to ensure that an analytical method is accurate for the known
properties of the reference material. Generally, the selected reference
material properties are similar to the environmental sample properties.
Replicate Samples
Replicate samples are a set of environmental samples collected in a manner
such that the samples are thought to be essentially identical in composition.
Replicate is the general case for which a duplicate is the special case
consisting of two samples. Replicate samples are collected and analyzed
to establish the amount of variability in the data contributed by some
part of the collection and analytical process. There are many types of
replicate samples possible, each of which may yield slightly different
results in a dynamic hydrologic setting, such as a flowing stream. The
types of replicate samples collected in this district are:
SEQUENTIAL SAMPLE--
a type of replicate sample in which the samples are collected one after
the other, typically over a short time.
SPLIT SAMPLE-- a type
of replicate sample in which a sample is split into subsamples contemporaneous
in time and space.
Spike Samples
Spike samples are samples to which known quantities of a solution with
one or more well-established analyte concentrations have been added. These
samples are analyzed to determine the extent of matrix interference or
degradation on the analyte concentration during sample processing and analysis.
Dissolved Trace-Element Concentrations
Traditionally, dissolved trace-element concentrations have been reported
at the microgram per liter (g/L) level. Recent evidence, mostly from large
rivers, indicates that actual dissolved-phase concentrations for a number
of trace elements are within the range of 10's to 100's of nanograms per
liter (ng/L). Data above the g/L level should be viewed with caution. Such
data may actually represent elevated environmental concentrations from
natural or human causes; however, these data could reflect contamination
introduced during sampling, processing, or analysis. To confidently produce
dissolved trace-element data with insignificant contamination, the USGS
began using new trace-element protocols at some stations in water year
1994.
Change in National Trends Network Procedures
Sample handling procedures at all National Trends Network stations were
changed substantially on January 11, 1994, in order to reduce contamination
from the sample shipping container. The data for samples before and after
that date are different and not directly comparable. A tabular summary
of the differences based on a special intercomparison study is available
from the NADP/NTN Coordination Office, Colorado State University, Fort
Collins, Colorado 80523.
Records of Ground-Water Quality Top
Records of ground-water quality in this report differ from other types
of records in that for most sampling sites they consist of only one set
of measurements for the water year. The quality of ground water ordinarily
changes only slowly; therefore, for most general purposes one annual sampling,
or only a few samples taken at infrequent intervals during the year, is
sufficient. Frequent measurement of the same constituents is not necessary
unless one is concerned with a particular problem, such as monitoring for
trends in nitrate concentration. In the special cases where the quality
of ground water may change more rapidly, more frequent measurements are
made to identify the nature of the changes.
Data Collection and Computation
The records of ground-water quality in this report were obtained mostly
as a part of special studies in specific areas. Consequently, a number
of chemical analyses are presented for some counties, but none are presented
for others. As a result, the records for this year, by themselves, do not
provide a balanced view of ground-water quality statewide. Such a view
can be attained only by considering records for this year in context with
similar records obtained for these and other counties in earlier years.
Most methods for collecting and analyzing water samples are described in
the U.S. Geological Survey Techniques of Water-Resources Investigation
manuals listed on pages 22-25. The values reported in this report represent
water-quality conditions at the time of sampling as much as possible, consistent
with available sampling techniques and methods of analysis. All samples
were obtained by trained personnel. The wells sampled were pumped long
enough to assure that the water collected came directly from the aquifer
and had not stood for a long time in the well casing where it would have
been exposed to the atmosphere and to the material, possibly metal, comprising
the casings.
Data Presentation
The records of ground-water quality are published in the section entitled
QUALITY OF GROUND WATER. Data for quality of ground water are listed alphabetically,
by county, and are identified by well number. The prime identification
number for wells sampled is the 15-digit number derived from the latitude-longitude
locations. No descriptive statements are given for ground-water-quality
records; however, the well number, depth of well, date of sampling, and
other pertinent data are given in the table containing the chemical analyses
of the ground water. The REMARK codes listed for surface-water-quality
records also are applicable to ground-water-quality records.
Access to USGS Water Data Top
The USGS provides near real-time stage and discharge data for many of the
gaging stations (equipped with the necessary telemetry) and historic daily-mean
and peak-flow discharge data for most current and discontinued gaging stations
through the World Wide Web. These data may be accessed at: http://www.water.usgs.gov
Some water-quality and ground-water data also are available through the
World Wide Web. In addition, data can be provided in various machine-readable
formats on magnetic tape or 3-1/2 inch floppy disk. Information about the
availability of specific types of data or products, and user charges, can
be obtained locally from each of the Water Resources Division District
offices.
Definition of Terms
Terms related to streamflow, water-quality, and other hydrologic data,
as used in this report, are defined below. See also table for converting
inch-pound units to International System of units (SI) on the inside of
back cover.
Acre-foot (AC-FT, acre-ft)
is the quantity of water required to cover 1 acre to a depth of 1 foot
and is equivalent to 43,560 cubic feet or about 326,000 gallons or 1,233
cubic meters.
Adenosine triphosphate
(ATP) is the primary energy donor in cellular life process. Its central
role in living cells makes it an excellent indicator of the presence of
living material in water. A measure of ATP, therefore, provides a sensitive
and rapid estimate of biomass. ATP is reported in micrograms per liter
of the original water sample.
Algae are mostly aquatic
single-celled, colonial, or multi-celled plants, containing chlorophyll
and lacking roots, stems, and leaves.
Algal growth potential (AGP)
is the maximum algal dry weight biomass that can be produced in a natural
water sample under standardized laboratory conditions. The growth potential
is the algal biomass present at stationary phase and is expressed as milligrams
dry weight of algae produced per liter of sample.
Aquifer is a geologic
formation, group of formations, or part of a formation that contains sufficient
saturated permeable material to yield significant quantities of water to
wells and springs.
Artesian means confined
and is used to describe a well in which the water level stands above the
top of the aquifer tapped by the well. A flowing artesian well is one in
which the water level is above the land surface.
Bacteria are microscopic
unicellular organisms, typically spherical, rodlike, or spiral and threadlike
in shape, often clumped into colonies. Some bacteria cause disease, others
perform an essential role in nature in the recycling of materials; for
example, by decomposing organic matter into a form available for reuse
by plants.
Total coliform bacteria
are a particular group of bacteria that are used as indicators of possible
sewage pollution. They are characterized as aerobic or facultative anaerobic,
gram-negative, nonspore-forming, rod-shaped bacteria, which ferment lactose
with gas formation within 48 hours at 35C. In the laboratory these bacteria
are defined as the organisms which produce colonies with a golden-green
metallic sheen within 24 hours when incubated at 35C 1.0C on M-Endo medium
(nutrient medium for bacterial growth). Their concentrations are expressed
as number of colonies per 100 mL of sample.
Fecal coliform bacteria
are bacteria that are present in the intestine or feces of warmblooded
animals. They are often used as indicators of the sanitary quality of the
water. In the laboratory they are defined as all organisms which produce
blue colonies within 24 hours when incubated at 44.5C 0.2C on M-FC medium
(nutrient medium for bacterial growth). Their concentrations are expressed
as number of colonies per 100 mL of sample.
Fecal streptococcal bacteria
are bacteria also found in the intestine of warmblooded animals. Their
presence in water is considered to verify fecal contamination. They are
characterized as gram-positive, cocci bacteria, which are capable of growth
in brain-heart infusion broth. In the laboratory they are defined as all
the organisms which produce red or pink colonies within 48 hours at 35C1.0C
on M-FS medium (nutrient medium for bacterial growth). Their concentrations
are expressed as number of colonies per 100 mL of sample.
Bed material is the
unconsolidated material of which a streambed, lake, pond, reservoir, or
estuary bottom is composed.
Biochemical oxygen demand
(BOD) is a measure of the quantity of dissolved oxygen, in milligrams per
liter, necessary for the decomposition of organic matter by microorganisms,
such as bacteria.
Biomass is the amount
of living matter present at any given time, expressed as the mass per unit
area or volume of habitat.
Ash mass is the mass
or amount of residue present after the residue from the dry mass determination
has been ashed in a muffle furnace at a temperature of 500C for 1 hour.
The ash mass values of zooplankton and phytoplankton are expressed in grams
per cubic meter (g/m 3 ), and periphyton and benthic organisms in
grams per square meter (g/m 2 ).
Dry mass refers to the
weight of residue present after drying in an oven at 60C for zooplankton
and 105C for periphyton, until the mass remains unchanged. This mass represents
the total organic matter, ash and sediment, in the sample. Dry mass values
are expressed in the same units as ash mass.
Organic mass or volatile
mass of the living substance is the difference between the dry mass and
the ash mass, and represents the actual mass of the living matter. The
organic mass is expressed in the same units as for ash mass and dry mass.
Cells/volume refers
to the number of cells or any organism which is counted by using a microscope
and grid or counting cell. Many planktonic organisms are multicelled and
are counted according to the number of contained cells per sample, usually
milliliters (mL) or liters (L).
Cfs-day is the volume
of water represented by a flow of 1 cubic foot per second for 24 hours.
It is equivalent to 86,400 cubic feet, approximately 1.9835 acre-feet,
or about 646,000 gallons or 2,447 cubic meters.
Chemical oxygen demand
(COD) is a measure of the chemically oxidizable material in the water,
and furnishes an approximation of the amount of organic and reducing material
present. The determined value may correlate with natural water color or
with carbonaceous organic contamination from sewage or industrial wastes.
Chlorophyll refers to
the green pigments of plants. Chlorophyll a and b are the two most common
pigments in plants.
Color unit is produced
by one milligram per liter of platinum in the form of the chloroplatinate
ion. Color is expressed in units of the platinum-cobalt scale.
Contents is the volume
of water in a reservoir or lake. Unless otherwise indicated, volume is
computed on the basis of a level pool and does not include bank storage.
Control designates a
feature downstream from the gage that determines the stage-discharge relation
at the gage. This feature may be a natural constriction of the channel,
an artificial structure, or a uniform cross section over a long reach of
the channel.
Cubic feet per second per
square mile (CFSM) is the average number of cubic feet of water flowing
per second from each square mile of area drained, assuming that the runoff
is distributed uniformly in time and area.
Cubic foot per second (FT
3 /s, ft 3 /s, CFS) is the rate of discharge representing a
volume of 1 cubic foot passing a given point during 1 second and is equivalent
to approximately 7.48 gallons per second or 448.8 gallons per minute or
0.02832 cubic meters per second.
Discharge is the volume
of water (or more broadly, volume of fluid plus suspended sediment) that
passes a given point within a given period of time.
Mean discharge (MEAN)
is the arithmetic mean of individual daily-mean discharges during a specific
period.
Annual 7-day minimum
is the lowest mean discharge for 7 consecutive days for a calender year
or a water year. Note that most low-flow frequency analyses of annual 7-day
minimum flows use a climatic year (April 1-March 31). The date shown in
the summary statistics table is the initial date of the 7-day period (This
value should not be confused with the 7-day 10-year low-flow statistic).
Dissolved refers to
the amount of substance present in true chemical solution. In practice,
however, the term includes all forms of substance that will pass through
a 0.45-micrometer membrane filter, and thus may include some very small
(colloidal) suspended particles. Analyses are performed on filtered samples.
Dissolved-solids concentration
of water is determined either analytically by the "residue-on-evaporation"
method, or mathematically by totaling the concentrations of individual
constituents reported in a comprehensive chemical analysis. During the
analytical determination of dissolved solids, the bicarbonate (generally
a major dissolved component of water) is converted to carbonate. Therefore,
in the mathematical calculation of dissolved-solids concentration, the
bicarbonate value, in milligrams per liter, is multiplied by 0.492 to reflect
the change.
Diversity index is a
measure of the distribution of aquatic organisms in a community. The formula
for diversity index is:
Where ni is the number of individuals
in the ith taxon, n is the total number of individuals in all the taxon,
and s is the total number of taxa in the sample of the community. Diversity
index values range from zero, when all the organisms in the sample are
the same, to some positive number, when some or all of the organisms in
the sample are different.
Drainage area of a stream
at a specified location is that area, measured in a horizontal plane, enclosed
by a topographic divide from which direct surface runoff from precipitation
normally drains by gravity into the river above the specified point. Figures
of drainage area given herein include all closed basins, or noncontributing
areas, within the area unless otherwise noted.
Drainage basin is a
part of the surface of the earth that is occupied by a drainage system,
which consists of a surface stream or a body of impounded surface water
together with all tributary surface streams and bodies of impounded surface
water.
Gage height (G.H.) is
the water-surface elevation referred to some arbitrary gage datum. Gage
height is often used interchangeably with the more general term stage,
although gage height is more appropriate when used with a reading on a
gage.
Gaging station is a
particular site on a stream, canal, lake, or reservoir where systematic
observations of hydrologic data are obtained.
Hardness of water is
a physical-chemical characteristic that is commonly recognized by the increased
quantity of soap required to produce lather. It is attributable to the
presence of alkaline earths (principally calcium and magnesium) and is
expressed as equivalent calcium carbonate (CaCO 3 ).
Hydrologic unit is a
geographic area representing part or all of a surface drainage basin or
distinct hydrologic feature as delineated by the Office of Water Data Coordination
on State Hydrologic Unit Maps; each hydrologic unit is identified by an
8-digit number.
Metamorphic stage refers
to the stage of development that an organism exhibits during its transformation
from an immature form to an adult form. This developmental process exists
for most insects, and the degree of difference from the immature stage
to the adult form varies from relatively slight to pronounced, with many
intermediates. Examples of metamorphic stages of insects are egg-larva-adult
or egg-nymph-adult.
Methylene blue active substance
(MBAS) is a measure of apparent detergents. This determination depends
on the formation of a blue color when methylene blue dye reacts with synthetic
detergent compounds.
Micrograms per gram
(UG/G, ug/g, g/g) is a unit expressing the concentration of a chemical
element as the mass (micrograms) of the element sorbed per unit mass (gram)
of sediment.
Micrograms per kilogram
(UG/KG, ug/kg) is a unit expressing the concentration of a chemical element
as the mass (micrograms) of the element sorbed per unit mass (kilogram)
of sediment.
Micrograms per liter
(UG/L, ug/L, g/L) is a unit expressing the concentration of chemical constituents
in solution as mass (micrograms) of solute per unit volume (liter) of water.
One thousand micrograms per liter is equivalent to one milligram per liter.
Milligrams per liter
(MG/L, mg/L) is a unit for expressing the concentration of chemical constituents
in solution. Milligrams per liter represent the mass of solute per unit
volume (liter) of water. Concentration of suspended sediment also is expressed
in mg/L, and is based on the mass of sediment per liter of water-sediment
mixture.
National Geodetic Vertical
Datum of 1929 (NGVD) is a geodetic datum derived from a general adjustment
of the first order level nets of both the United States and Canada. It
was formerly called "Sea Level Datum of 1929" or "mean sea level" in this
series of reports. Although the datum was derived from the average sea
level over a period of many years at 26 tide stations along the Atlantic,
Gulf of Mexico, and Pacific Coasts, it does not necessarily represent local
mean sea level at any particular place.
National Stream Quality
Accounting Network (NASQAN) is a nationwide data-collection network
designed by the U.S. Geological Survey to meet many of the information
needs of government agencies and other groups involved in natural or regional
water-quality planning and management. The 500 or so sites in NASQAN are
generally located at the downstream ends of hydrologic accounting units
designated by the U.S. Geological Survey Office of Water Data Coordination
in consultation with the Water Resources Council. The objective of NASQAN
is to obtain information on the quality and quantity of water moving within
and from the United States through a systematic and uniform process of
data collection, summarization, analysis, and reporting such that the data
may be used for: (1) description of the areal variability of water quality
in the Nation's rivers through analysis of data from this and other programs,
(2) detection of changes or trends with time in the pattern of occurrence
of water-quality characteristics, and (3) providing a nationally consistent
data base useful for water-quality assessment and hydrologic research.
The National Trends Network
(NTN) is a 150-station network for sampling atmospheric deposition in the
United States. The purpose of the network is to determine the variability,
both in location and in time, of the composition of atmospheric deposition,
which includes snow, rain, dust particles, aerosols, and gases. The core
from which the NTN was built was the already-existing deposition-monitoring
network of the National Atmospheric Deposition Program (NADP).
Normal is a central
value (such as median) for a 30-year period ending with an even 10-year,
e.g. 1931-60, or 1961-90.
Organism count/area
refers to the number of organisms collected and enumerated in a sample
and adjusted to the number per area habitat, usually square meters (m
2 ), acres, or hectares. Periphyton, benthic organisms, and macrophytes
are expressed in these terms.
Organism count/volume
refers to the number of organisms collected and enumerated in a sample
and adjusted to the number per sample volume, usually milliliters (mL)
or liters (L). Numbers of planktonic organisms can be expressed in these
terms.
Total organism count
is the total number of organisms collected and enumerated in any particular
sample.
Parameter code numbers
are unique five-digit code numbers assigned to each parameter placed into
storage. These codes are assigned by the U.S. Environmental Protection
Agency and are also used to identify data exchanged among agencies.
Partial-record station
is a particular site where limited streamflow and (or) water-quality data
are collected systematically over a period of years for use in hydrologic
analyses.
Particle size is the
diameter, in millimeters (mm), of suspended sediment or bed material determined
by either sieve or sedimentation methods. Sedimentation methods (pipet,
bottom-withdrawal tube, visual-accumulation tube) determine fall diameter
of particles in distilled water (chemically dispersed).
Particle-size classification
used in this report agrees with recommendations made by the American Geophysical
Union Subcommittee on Sediment Terminology.
The particle-size distributions
given in this report are not necessarily representative of all particles
in transport in the stream. Most of the organic material is removed and
the sample is subjected to mechanical and chemical dispersion before analysis
in distilled water.
Percent composition
is a unit for expressing the ratio of a particular part of a sample or
population to the total sample or population, in terms of types, numbers,
mass or volume.
Periphyton is the assemblage
of microorganisms attached to and growing upon solid surfaces. While primarily
consisting of algae, they also include bacteria, fungi, protozoa, rotifers,
and other small organisms. Periphyton is a useful indicator of water quality.
Pesticides are chemical
compounds used to control undesirable plants and animals. Major categories
of pesticides include insecticides, miticides, fungicides, herbicides,
and rodenticides. Insecticides and herbicides, which control insects and
plants, respectively, are the two categories reported.
pH is a measure of the
acidity (or alkalinity) of a solution equal to the negative logarithm of
the concentration of the hydrogen ions. A pH of 7.0 indicates a neutral
solution, a pH value lower than 7.0 indicates an acid solution, and a pH
greater than 7.0 indicates an alkaline solution.
Picocurie (PC, pCi)
is one trillionth (1 x 10 -12 ) of the amount of radioactivity represented
by a curie (Ci). A curie is the amount of radioactivity that yields 3.7
x 1,0 10 radioactive disintegrations per second. A picocurie yields
2.22 dpm (disintegrations per minute).
Plankton is the community
of suspended, floating, or weakly swimming organisms that live in the open
water of lakes and rivers.
Phytoplankton is
the plant part of the plankton. They are usually microscopic and their
movement is subject to the water currents. Phytoplankton growth is dependent
upon solar radiation and nutrient substances. Because they are able to
incorporate as well as release materials to the surrounding water, the
phytoplankton have a profound effect upon the quality of the water. They
are the primary food producers in the aquatic environment, and are commonly
known as algae.
Blue-green algae
are a group of phytoplankton organisms having a blue pigment, in addition
to the green pigment called chlorophyll. Blue-green algae often cause nuisance
conditions in water.
Diatoms are the
unicellular or colonial algae having a siliceous shell. Their concentrations
are expressed as number of cells/mL of sample.
Green algae have
chlorophyll pigments similar in color to those of higher green plants.
Some forms produce algal mats or floating "moss" in lakes. Their concentrations
are expressed as number of cells/mL of sample.
Zooplankton is
the animal part of the plankton. Zooplankton are capable of extensive movements
within the water column, and are often large enough to be seen with the
unaided eye. Zooplankton are secondary consumers feeding upon bacteria,
phytoplankton, and detritus. Because they are the grazers in the aquatic
environment, the zooplankton are a vital part of the aquatic food web.
The zooplankton community is dominated by small crustaceans and rotifers.
Polychlorinated biphenyls
(PCBs) are industrial chemicals that are mixtures of chlorinated biphenyl
compounds having various percentages of chlorine. They are similar in structure
to organo-chlorine insecticides.
Primary productivity
is a measure of the rate at which new organic matter is formed and accumulated
through photosynthetic and chemosynthetic activity of producer organisms
(chiefly green plants). The rate of primary production is estimated by
measuring the amount of oxygen released (oxygen method) or the amount of
carbon assimilated by the plants (carbon method).
Milligrams of carbon per
area or volume per unit time [mg C/m 2 x time for periphyton
and macrophytes and mg C/m 3 x time for phytoplankton] are units
for expressing primary productivity. They define the amount of carbon dioxide
consumed as measured by radioactive carbon (carbon 14). The carbon 14 method
is of greater sensitivity than the oxygen light and dark bottle method,
and is preferred for use in unenriched waters. Unit time may be either
the hour or day, depending on the incubation period.
Milligrams of oxygen per
area or volume per unit time [mg 0 2 /m 2 x time for
periphyton and macrophytes and mg 0 2 /m 3 x time) for phytoplankton]
are the units for expressing primary productivity. They define production
and respiration rates as estimated from changes in the measured dissolved
oxygen concentration. The oxygen light and dark bottle method is preferred
if the rate of primary production is sufficient for accurate measurements
to be made within 24 hours. Unit time may be either the hour or day, depending
on the incubation period.
Radiochemical program
is a network of regularly sampled water-quality stations where samples
are collected to be analyzed for radioisotopes. The streams that are sampled
represent major drainage basins in the conterminous United States.
Recoverable from bottom
material is the amount of a given constituent that is in solution after
a representative sample of bottom material has been digested by a method
(usually using an acid or mixture of acids) that results in dissolution
of only readily soluble substances. Complete dissolution of all bottom
material is not achieved by the digestion treatment and thus the determination
represents less than the total amount (that is, less than 95 percent) of
the constituent in the sample. To achieve comparability of analytical data,
equivalent digestion procedures would be required of all laboratories performing
such analyses because different digestion procedures are likely to produce
different analytical results.
Return period is the
average time interval between occurrences of a hydrological event of a
given or greater magnitude, usually expressed in years. May also be called
recurrence interval.
Runoff in inches (IN,
in) shows the depth to which the drainage area would be covered if all
the runoff for a given time period were uniformly distributed on it.
Sea level: In this report
"sea level" refers to the National Geodetic Vertical Datum of 1929 (NGVD
of 1929)--a geodetic datum derived from a general adjustment of the first-order
level nets of both the United States and Canada, formerly called Sea Level
Datum of 1929.
Sediment is solid material
that originates mostly from disintegrated rocks and is transported by,
suspended in, or deposited from water; it includes chemical and biochemical
precipitates and decomposed organic material, such as humus. The quantity,
characteristics, and cause of the occurrence of sediment in streams are
influenced by environmental factors. Some major factors are degree of slope,
length of slope, soil characteristics, land usage, and precipitation.
Bed load is the
sediment that is transported in a stream by rolling, sliding, or skipping
along the bed and very close to it. In this report, bed load is considered
to consist of particles in transit within 0.25 ft of the streambed.
Bed load discharge
(tons per day) is the quantity of bed load measured by dry weight that
moves past a section as bed load in a given time.
Mean concentration
is the time-weighted concentration of suspended sediment passing a stream
section during a 24-hour period.
Suspended sediment
is the sediment that at any given time is maintained in suspension by the
upward components of turbulent currents, or that exists in suspension as
a colloid.
Suspended-sediment
concentration is the velocity-weighted concentration of suspended sediment
in the sampled zone (from the water surface to a point approximately 0.3
ft above the bed) expressed as milligrams of dry sediment per liter of
water-sediment mixture (mg/L).
Suspended-sediment
discharge (tons/day) is the rate at which dry weight of sediment passes
a section of a stream or is the quantity of sediment, as measured by dry
weight or volume, that passes a section in a given time. It is computed
by multiplying discharge by mg/L by 0.0027.
Total sediment discharge
(tons/day) is the sum of the suspended-sediment discharge and the bed-load
discharge. It is the total quantity of sediment, as measured by dry weight
or volume, that passes a section during a given time.
Total sediment load
or total load is a term which refers to the total sediment (bed load
plus suspended-sediment load) that is in transport. It is not synonymous
with total-sediment discharge.
7-day 10 year low flow
(7 Q 10 ) is the discharge at the 10-year recurrence interval taken
from a frequency curve of annual values of the lowest mean discharge for
7 consecutive days (the 7-day low flow).
Sodium-adsorption-ratio
(SAR) is the expression of relative activity of sodium ions in exchange
reactions within soil and is an index of sodium or alkali hazard to the
soil. Waters range in respect to sodium hazard from those which can be
used for irrigation on almost all soils to those which are generally unsatisfactory
for irrigation.
Solute is any substance
derived from the atmosphere, vegetation, soil, or rocks that is dissolved
in water.
Specific conductance
is a measure of the ability of a water to conduct an electrical current.
It is expressed in microsiemens per centimeter at 25C. Specific conductance
is related to the type and concentration of ions in solution and can be
used for approximating the dissolved-solids content of the water. Commonly,
the concentration of dissolved solids (in milligrams per liter) is about
65 percent of the specific conductance (in microsiemens). This relation
is not constant from stream to stream, and it may vary in the same source
with changes in the composition of the water.
Stage-discharge relation
is the relation between gage height (stage) and volume of water per unit
of time flowing in a channel.
Streamflow is the discharge
that occurs in a natural channel. Although the term "discharge" can be
applied to the flow of a channel, the word "streamflow" uniquely describes
the discharge in a surface stream course. The term "streamflow" is more
general than "runoff" as a streamflow may be applied to discharge whether
or not it is affected by diversion or regulation.
Artificial substrate
is a device which is purposely placed in a stream or lake for colonization
of organisms. The artificial substrate simplifies the community structure
by standardizing the substrate from which each sample is taken. Examples
of artificial substrates are basket samplers (made of wire cages filled
with clean streamside rocks) and multi-plate samplers (made of hardboard)
for benthic organism collection, and plexiglass strips for periphyton collection.
Natural substrates
refers to any naturally occurring emersed or submersed solid surface, such
as a rock or tree, upon which an organism lives.
Surface area of a lake
is that area outlined on the latest USGS topographic map as the boundary
of the lake and measured by a planimeter in acres. In localities not covered
by topographic maps, the areas are computed from the best maps available
at the time planimetered. All areas shown are those for the stage when
the planimetered map was made. All areas shown are those for the stage
when the planimetered map was made.
Surficial bed material
is that part (0.1-0.2 ft) of the bed material that is sampled using U.S.
Series Bed-Material Samplers.
Suspended (as used in
tables of chemical analyses) refers to the amount (concentration) of the
total concentration in a water-sediment mixture. The water-sediment mixture
is associated with (or sorbed on) that material retained on a 0.45 micrometer
filter.
Suspended, recoverable
is the amount of a given constituent that is in solution after the part
of a representative water-suspended sediment sample that is retained on
a 0.45 micrometer filter has been digested by a method (usually using a
dilute acid solution) that results in dissolution of only readily soluble
substances. Complete dissolution of all the particulate matter is not achieved
by the digestion treatment and thus the determination represents something
less than the "total" amount (that is, less than 95 percent) of the constituent
present in the sample. To achieve comparability of analytical data, equivalent
digestion procedures would be required of all laboratories performing such
analyses because different digestion procedures are likely to produce different
analytical results.
Determinations of suspended,
recoverable constituents are made either by analyzing portions of the material
collected on the filter or, more commonly, by difference, based on determinations
of (1) dissolved and (2) total recoverable concentrations of the constituent.
Suspended, total is
the amount of a given constituent in the part of a representative water-suspended
sediment sample that is retained on a 0.45 micrometer membrane filter.
This term is used only when the analytical procedure assures measurement
of at least 95 percent of the constituent determined. A knowledge of the
expected form of the constituent in the sample, as well as the analytical
methodology used, is required to determine when the results should be reported
as suspended, total.
Determinations of suspended,
total constituents are made either by analyzing portions of the material
collected on the filter or, more commonly, by difference, based on determinations
of (1) dissolved and (2) total concentrations of the constituent.
Taxonomy is the division
of biology concerned with the classification of organisms based upon a
hierarchical scheme beginning with Kingdom and ending with Species at the
base. The higher the classification level, the fewer features the organisms
have in common. For example, the taxonomy of a particular mayfly, Hexagenia
limbata is the following:
Thermograph is an instrument
that continuously records variations of temperature on a chart. The more
general term "temperature recorder" is used in the table headings and refers
to any instrument that records temperature whether on a chart, a tape,
or any other medium.
Time-weighted average
is computed by multiplying the number of days in the sampling period by
the concentrations of individual constituents for the corresponding period
and dividing the sum of the products by the total number of days. A time-weighted
average represents the composition of water that would be contained in
a vessel or reservoir that had received equal quantities of water from
the stream each day for the year.
Tons per acre-foot indicates
the dry mass of dissolved solids in 1 acre-foot of water. It is computed
by multiplying the concentration in milligrams per liter by 0.00136.
Tons per day is the
quantity of substance in solution or suspension that passes a stream section
during a 24-hour day.
Total is the amount
of a given constituent in a representative water-suspended sediment sample,
regardless of the constituent's physical or chemical form. The term is
used only when the analytical procedure assures measurement of at least
95 percent of the constituent present in both the dissolved and suspended
phases of the sample. A knowledge of the expected form of the constituent
in the sample, as well as the analytical methodology used, is required
to judge when the results should be reported as total. (Note that the word
"total" does double duty here, indicating both that the sample consists
of a water-suspended sediment mixture and that the analytical methods determine
all of the constituent in the sample).
Total in bottom material
is the amount of a given constituent in a representative sample of bottom
material. This term is used only when the analytical procedure assures
measurement of at least 95 percent of the constituent determined. A knowledge
of the expected form of the constituent in the sample, as well as the analytical
methodology used, is required to judge when the results should be reported
as total in bottom material.
Total load (tons) is
the quantity of any individual constituent, as measured by dry mass or
volume, that is dissolved in a specific amount of water (discharge) during
a given time. It is computed by multiplying the total discharge, by the
mg/L of the constituent, by the factor 0.0027, by the number of days.
Total recoverable refers
to the amount of a given constituent that is in solution after a representative
water-suspended sediment sample has been digested by a method (usually
using a dilute acid solution) that results in dissolution of only readily
soluble substances. Complete dissolution of all particulate matter is not
achieved by the digestion treatment, and thus the determination represents
something less than the total amount (that is, less than 95 percent) of
the constituent percent in the dissolved and suspended phases of the sample.
To achieve comparability of analytical data, equivalent digestion procedures
would be required of all laboratories performing such analyses because
different digestion procedures are likely to produce different analytical
results.
Tritium Network refers
to the stations which have been established to provide baseline information
on the occurrence of tritium in the Nation's surface waters. In addition
to the surface-water stations in the network, tritium data are also obtained
at a number of precipitation stations. The purpose of the precipitation
stations is to provide an estimate sufficient for hydrologic studies of
the tritium input to the United States.
Water year in USGS reports
dealing with surface-water supply is the 12-month period, October 1 through
September 30. The water year is designated by the calendar year in which
it ends and which includes 9 of the 12 months. Thus, the year ending September
30, l992 is called the "1992 water year."
WDR is used as an abbreviation
for Water-Data Report in reference to published reports beginning in 1975.
Weighted average is
used in this report to indicate discharge-weighted average. It is computed
by multiplying the discharge for a sampling period by the concentrations
of individual constituents for the corresponding period and dividing the
sum of the products by the sum of the discharges. A discharge-weighted
average approximates the composition of water that would be found in a
reservoir containing all the water passing a given location during the
water year after thorough mixing in the reservoir.
WRD is used as an abbreviation
for Water-Resources Data in the REVISED RECORDS paragraph to refer to State
annual basic-data reports published before 1975.
WSP is used as an abbreviation
for "Water-Supply Paper" in references to previously published reports. Top |
![]() U.S. Department of the Interior |
U.S. Geological Survey
U.S. Department of the Interior |
U.S. Geological Survey
URL: http://mn.water.usgs.gov/infodata/ann-repts/annrpt98/introduction.html
Page Contact Information: Webmaster
Page Last Modified: Thursday, 08-Jan-2009 17:21:54 EST


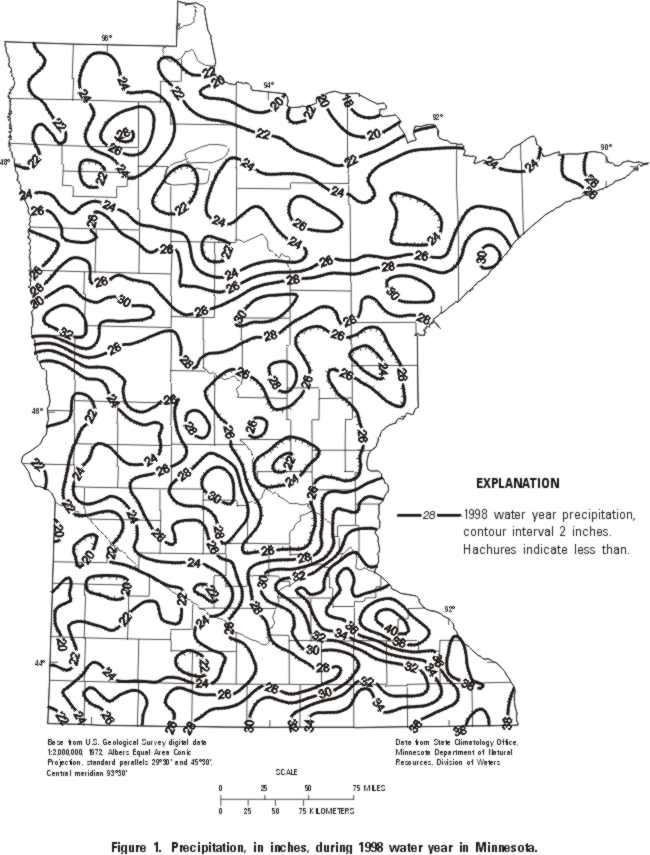
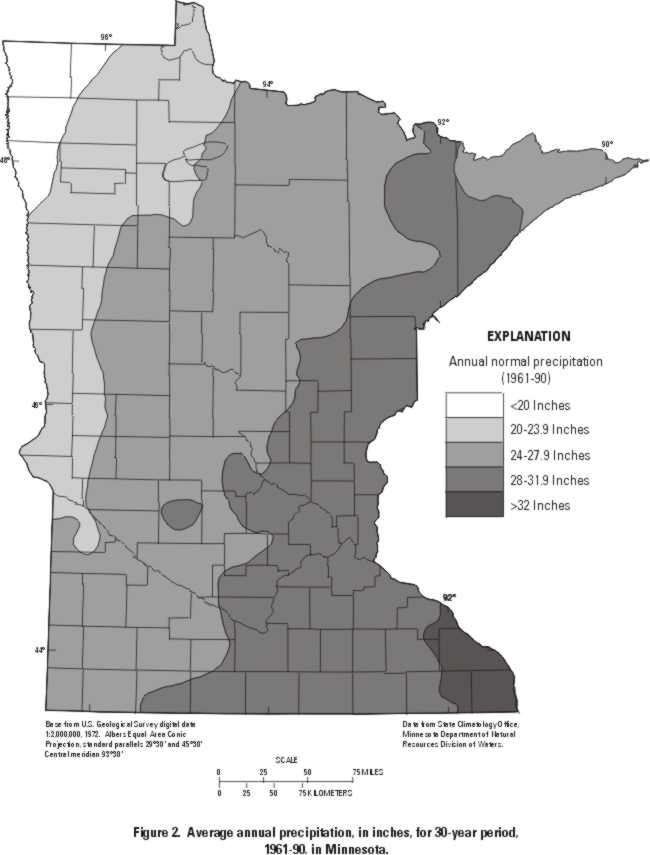
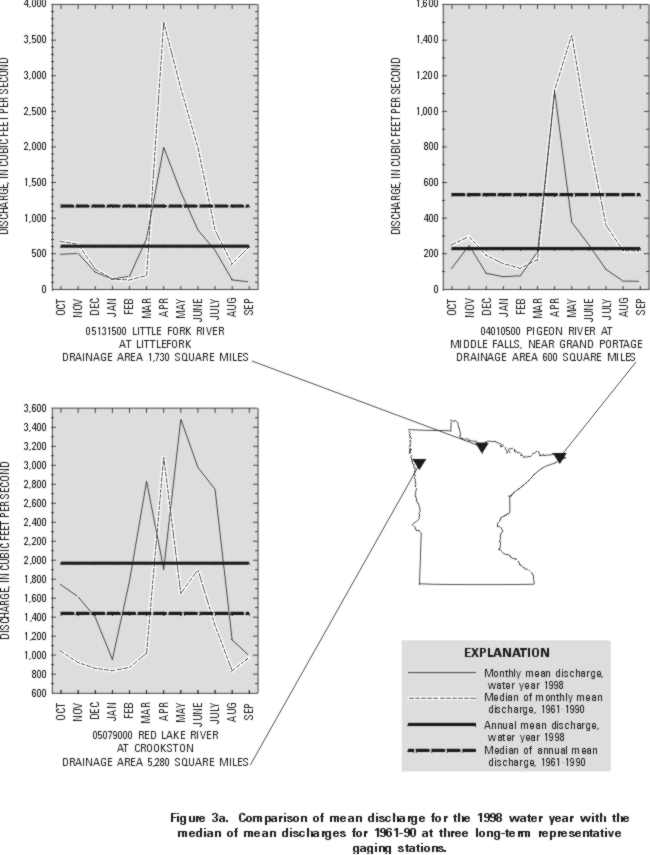
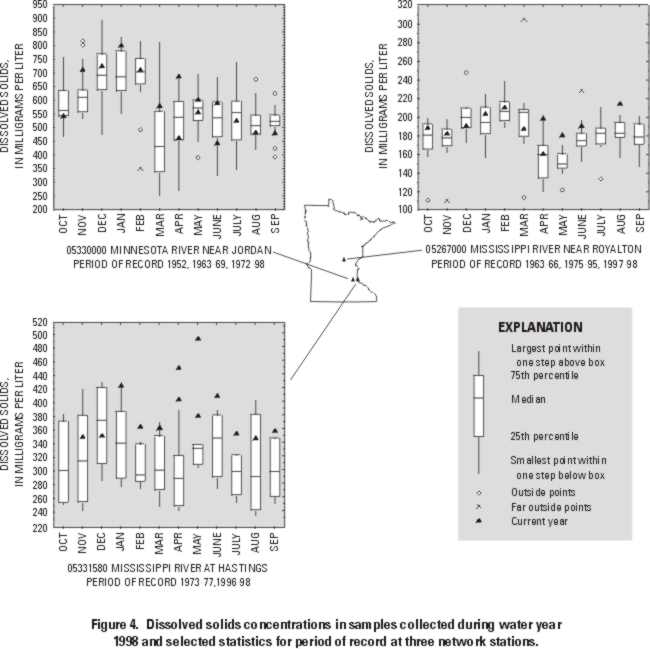
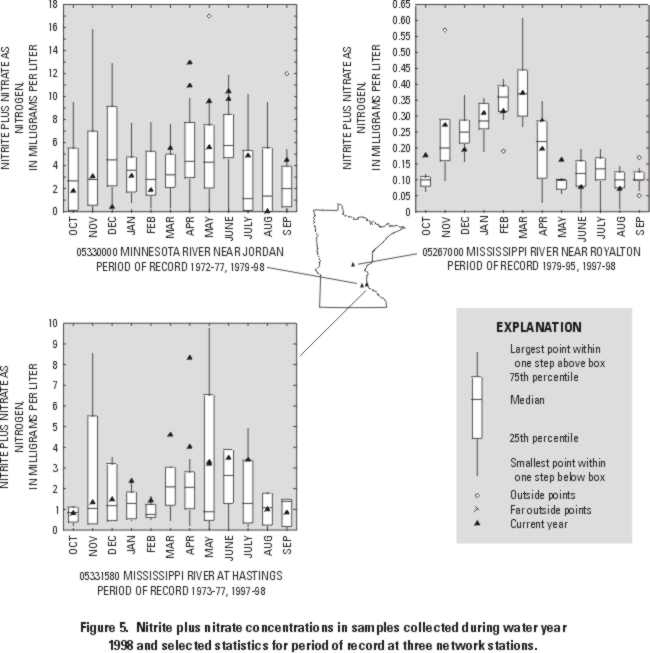
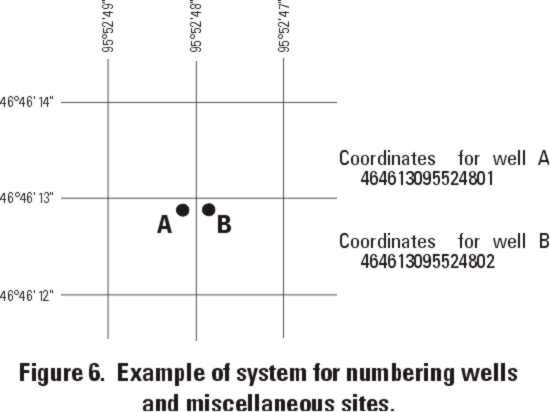
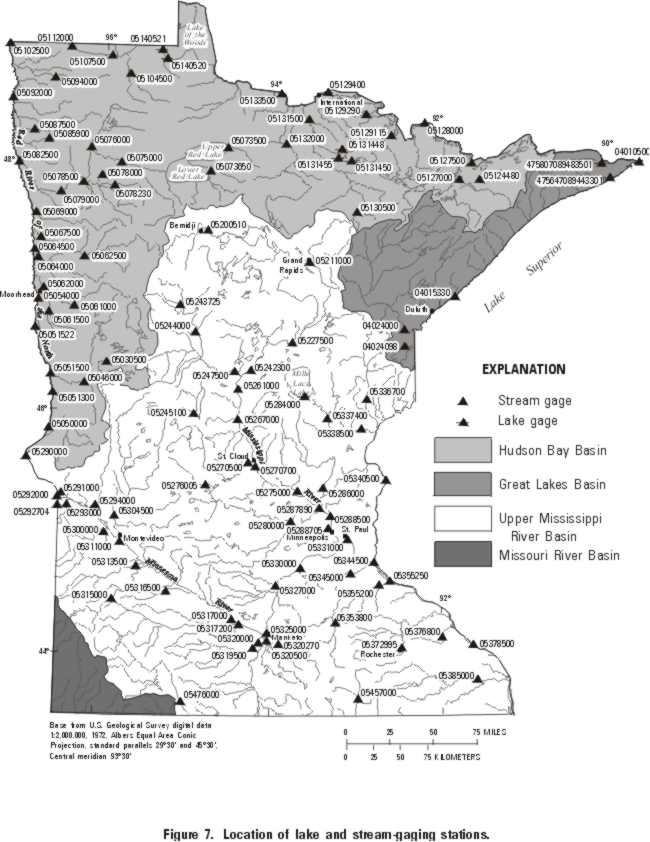
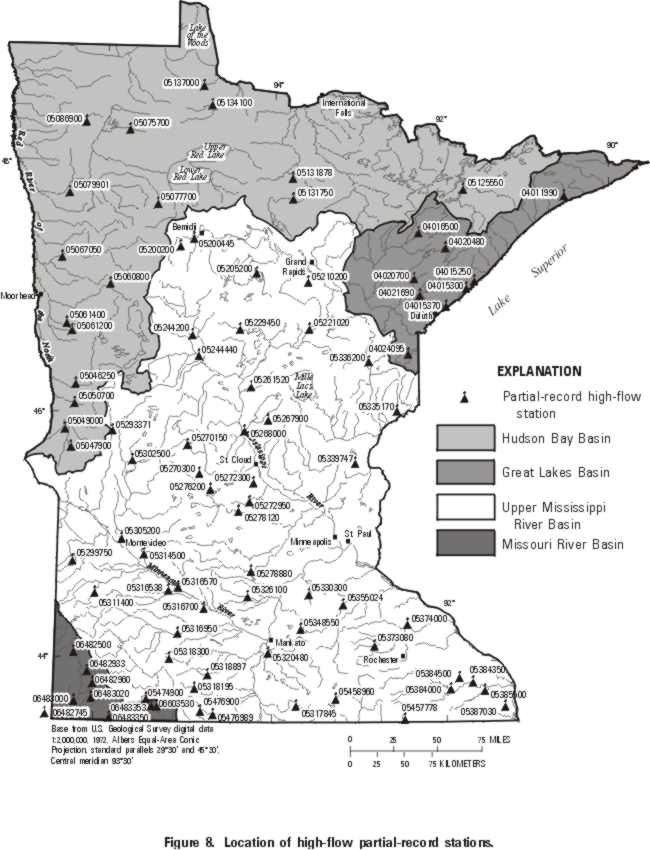