RedN NAWQA
USGS IN YOUR STATE
USGS Water Science Centers are located in each state.
|
National Water-Quality Assessment Program
Brigham, M.E., Tornes, L.H., and Lorenz, D.L., 1994, Load Estimates for
Pesticides in the Red River of the North Drainage Basin: American
Geophysical Union, EOS Transactions, Abstracts for Fall Meeting -- December
5-9, 1994, p. 230.
Abstract
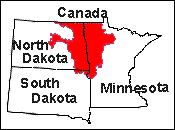
As part of the National Water-Quality Assessment program, the U.S. Geological Survey is studying the presence and fate of agricultural chemicals in the Red River of the North drainage basin (Red River Basin). From March to December 1993, including an unusually wet mid-summer period, about 20 samples for pesticide analyses were collected from each of four streams, over a large range of streamflow. Sites include the Red River Basin outflow at the Canadian border (Emerson, Manitoba) and three smaller subbasins (Table 1). These streams drain land cropped mainly in small grains (wheat and barley), with lesser amounts of soybeans, hay, corn, and other crops. Annual loads of selected pesticides were calculated from a summation of daily loads, where concentrations were interpolated between sampling dates. Based on other data, loads during January and February were assumed to be negligible. In 1993, the greatest annual pesticide loads at the Red River at Emerson, Manatoba were for bentazon (1,400 kilograms (kg)), atrazine (610 kg), and cyanazine (280 kg). The 1993 load values indicate that less than 1 percent of applied bentazon, atrazine, and cyanazine is transported out of the basin by the river. Other herbicides, 2,4-D, MCPA, and trifluralin, were more heavily applied but their concentrations usually were low or below analytical detection limits; their annual loads were small relative to their usage.
Atrazine was the most frequently detected pesticide at each stream site. The southern part of the Red River Basin, where corn is most widely grown, has a greater amount of atrazine use per land area than any of the three subbasins sampled (all of which are in the northern half of the Red River Basin). However, 1993 data indicate that the Wild Rice River Basin, where, based on corn acreage, atrazine application is low, had the greatest atrazine yield. Factors other than application rates, such as chemical degradation and intensity and timing of runoff, also affect the amount of atrazine reaching stream-basin outflows.
Table 1. Estimated atrazine usage and stream loads for 1992 in the Red River
ofthe North drainage basin.
----------------------------------------------------------------------------
Site name Drainage area, Atrazine Atrazine load,
in square usage, in in kilograms
kilometers kilograms(a)
----------------------------------------------------------------------------
Wild Rice River at Twin 2,407 1,250 22
Valley, Minn.
Turtle River near Larimore, 806 780 .37
N. Dak.
Snake River at Alvarado, 566 240 1.3
Minn.
Red River at Emerson, 90,600 115,000 610
Manitoba
----------------------------------------------------------------------------
- (a)
- Estimated based on area having corn crops and average atrazine-application rates in the region.
|