|
New Report on Nutrients in the Nation's Streams and Groundwater
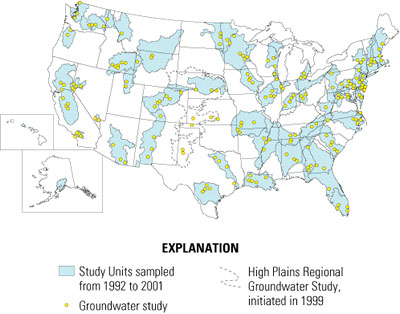
A comprehensive national analysis of nutrients in streams and groundwater from 1992 through 2004 is now available through the National Water-Quality Assessment (NAWQA) Program.
Findings describe nutrient occurrence, key sources of nutrients, potential effects on humans and aquatic life, and changes in concentrations since the early 1990s. Results show that excessive nutrient enrichment is a widespread cause of ecological degradation in streams and that nitrate contamination of groundwater used for drinking water, particularly in shallow domestic wells in agricultural areas, is a continuing human-health concern. Despite major Federal, State, and local efforts to control point and non-point sources and transport of nutrients, concentrations of nutrients have remained the same or increased in many streams and aquifers across the Nation since the early 1990s.The results of this study are described in two USGS publications: a USGS Fact Sheet (2010-3078) highlights selected national findings and their implications, and serves as a companion product to the complete analysis reported in the USGS Circular (1350).
Report Finds No Consistent Decline in Nitrate Levels in the Mississippi River
Despite efforts to reduce nitrate in the Mississippi River basin, nitrate concentrations and transport at eight main-stem or large tributary sites have not declined from 1980-2008. The results are based on a new statistical method developed by the USGS that takes into account variation in river flows, in order to paint an accurate picture of long-term trends. These results reflect the cumulative changes over time in nitrate sources and conservation practices throughout the Mississippi River basin and highlight the need for comprehensive nutrient management strategies that will reduce nutrients in both streams and groundwater.
Key Findings:
- Nitrate concentrations increased considerably at two sites (Mississippi River at Clinton, IA and at Missouri River at Hermann, MO).
- Nitrate concentrations remained very nearly the same or increased at the other six sites.
- Nitrate transport to the Gulf of Mexico increased from 1980 to 2008.
- Increases in nitrate concentrations in groundwater are having a substantial effect on nitrate concentrations in rivers and transport to the Gulf of Mexico.
Released in the journal of Environmental Science & Technology
Contact:
Lori Sprague
Robert Hirsch
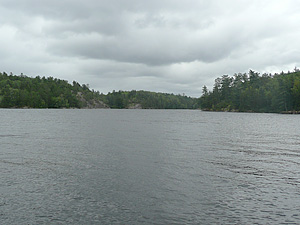
Report Published on Kabetogama Lake, Voyageurs National Park
A recent report documents water- and sediment-quality data collected during 2008-09 to assess internal and external nutrient loading to Kabetogama Lake in Voyageurs National Park. Data collection was focused in Kabetogama Lake and its inflows, the area of greatest concern for eutrophication among the lakes of Voyageurs National Park. Nutrient and algal data were used to determine trophic status and were evaluated in relation to changes in Kabetogama Lake water levels following changes to dam operation in 2000. Stratification, combined with larger bottom-water nutrient concentrations, bottom sediment phosphorus concentrations, and estimated phosphorus release rates from sediment cores indicate that Lost Bay may be one of several areas that may be contributing substantially to internal loading. Comparisons of the results of this study to previous studies indicate that chlorophyll-a concentrations and trophic state indices have improved since 2000.
The full report is available online.
Project Update-- Groundwater and Surface-Water Interactions in White Bear Lake, Minnesota
Perry Jones collecting
the Eco Mapper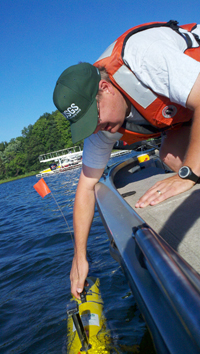 |
The objective of this study is to characterize groundwater and surface-water interactions in White Bear Lake and the response of lake water levels to changes in precipitation and groundwater flow conditions. A series of water samples were collected from lakes, snow, rain, and groundwater to assess water balance and groundwater/surface-water interactions. The USGS is working with several state, county, and city agencies, watershed organizations and private organizations to complete this study. Surface-water samples were collected from White Bear, Bald Eagle, and Lost Lakes to assess seasonal variability of isotopic composition of the surface water and changes in water balance in the lake. Snow samples were collected at four locations along the lake shore to determine the isotopic composition of snow within the watershed. Water samples also were collected through ice at one of the deepest parts of White Bear Lake to determine isotopic composition of lake water. Specific conductance and water temperatures were measured at various depths at that location. In May, groundwater samples were collected from two wells, one open to the St. Peter Sandstone aquifer and the other open to the Prairie du Chien aquifer, to determine the isotopic composition of local groundwater in the two aquifers.
In March, a lake sediment core was collected and sediment penetration probe measurements were made by researchers from the University of Minnesota, Limnological Research Center, LacCore Facility from the deepest depth of White Bear Lake to determine the thicknesses of low-permeable organic sediments on the lakes bottom. Between June 6 and 17, land surface elevations were measured at 223 of the 236 wells where water level measurements had been made. The elevations were surveyed in using GPS remote units and the Minnesota Department of Transportation CORS GPS Network. LiDAR data from the Rice Creek Watershed District were used to estimate land surface elevations at wells where no existing land surface elevations or no GPS elevation data could not be collected. In July, USGS hydrologists from the Minnesota and Illinois Water Science Centers conducted a water-quality survey of White Bear Lake using autonomous underwater vehicle with a multi-parameter probes. The survey was done to identify potential areas of groundwater inflow to the lake. The vehicle measured water temperature, pH, specific conductance, dissolved oxygen concentrations, turbidity, blue-green algae content, and chlorophyll values at one second intervals. The vehicle was run along transects through approximately 70% of the lakes area, focused on the deeper portions of the lake.
Contact: Perry Jones
USGS Environmental Effects of Agricultural Conservation (EEAC) Team meets in Minnesota
The USGS EEAC team is a group of scientists from across the Midwest that recently met with stakeholders in Olivia, MN to discuss a new study on the West Fork Beaver Creek. The West Fork Beaver Creek basin is over 90 percent agricultural and has experienced improvements in water quality. Land in the West Fork Beaver Creek basin has been taken out of crop production through both Federal (Conservation Reserve) and state (Reinvest in Minnesota) programs. In fact, Renville County, of which West Fork Beaver Creek is a part, has the largest number of Reinvest in Minnesota (RIM) contracts in the state of Minnesota. The USGS Minnesota Water Science Center has been working with the Board of Water and Soil Resources and Hawk Creek Watershed Project since 2005 to complete studies that have linked water quality to conservation practices-specifically land retirement. Results of these studies have led to interest from others including the USGS EEAC team, which will begin research in the basin this fall. The research will build on the initial findings of Christensen and others (2009) to further address the linkages between riparian buffer extent, age, and continuity, and stream water and biotic quality-with a specific emphasis on sediment and phosphorous.
Contact: Victoria Christensen
New Book on Minnesota Water Policy
Minnesota has a unique role in U.S. water policy. Hydrologically, it is a state with more than 12,000 lakes, an inland sea, and the headwaters of three major river systems: the St Lawrence, the Red River of the North, and the Mississippi. Institutionally, Minnesota is also unique. All U.S. states use Total Maximum Daily Load (TMDL) approaches to addressing impaired waters. Every TMDL requires a substantial investment of resources, including data collection, modeling, stakeholder input and analysis, a watershed management plan, as well as process and impact monitoring. Minnesota is the only state in the union that has passed legislation (the 2007 Clean Water Legacy Act) providing significant resources to support the TMDL process. The book is intended to be a guide for policymakers and decision makers who are interested in learning about alternative approaches to water management. Non-governmental organizations interested in stimulating effective water-quality policy will also find this a helpful resource. Finally, there are similarities between the lessons learned in Minnesota and the goals of water policy in several other states and nations, where there are competing uses of water for households, agriculture, recreation, and navigation.
Report Released on Nutrient Inputs to the Great Lakes
Nutrient input to the Laurentian Great Lakes continues to cause problems with eutrophication. To reduce the extent and severity of these problems, target nutrient loads were established and Total Maximum Daily Loads are being developed for many tributaries. Without detailed loading information it is difficult to determine if the targets are being met and how to prioritize rehabilitation efforts. To help address these issues, SPAtially Referenced Regressions On Watershed attributes (SPARROW) models were developed for estimating loads and sources of phosphorus (P) and nitrogen (N) from the United States (U.S.) portion of the Great Lakes, Upper Mississippi, Ohio, and Red River Basins. Results indicated that recent U.S. loadings to Lakes Michigan and Ontario are similar to those in the 1980s, whereas loadings to Lakes Superior, Huron, and Erie decreased. Highest loads were from tributaries with the largest watersheds, whereas highest yields were from areas with intense agriculture and large point sources of nutrients. Tributaries were ranked based on their relative loads and yields to each lake. Input from agricultural areas was a significant source of nutrients, contributing 33-44% of the P and 33-58% of the N, except for areas around Lake Superior with little agriculture. Point sources were also significant, contributing approximately 14-44% of the P and 13-34% of the N. Watersheds around Lake Erie contributed nutrients at the highest rate (similar to intensively farmed areas in the Midwest) because they have the largest nutrient inputs and highest delivery ratio.
Robertson, Dale M. and David A. Saad, 2011. Nutrient Inputs to the Laurentian Great Lakes by Source and Watershed Estimated Using SPARROW Watershed Models. Journal of the American Water Resources Association (JAWRA)
|
Employee Spotlight-Dave Lorenz
Dave Lorenz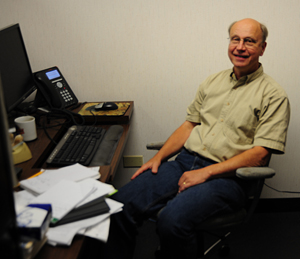 |
Dave began his USGS career in 1978 as a Hydrologic Field Assistant for the Water Resources Division in Grand Rapids, Minnesota. In 1980, Dave transferred to the St. Paul, Minnesota office and completed his Bachelor's degrees in biology and in Civil Engineering. In 1983 Dave's appointment was changed to a hydrologist and he conducted numerous hydrologic studies, including flood frequency analyses, regression analyses and applied statistical analyses and programming to support many District projects. As his level of experience grew, Dave took on additional responsibilities including the support for and training of hydrologists nationwide in the application of S-Plus statistical software. In 2006, Dave became the Minnesota Water Science Center's Surface Water Specialist. Throughout Dave's career he has typified unselfish service to the USGS and as a volunteer to the communities in which he has lived. Dave has collaborated with scientists within the USGS and with other scientists throughout the Nation. He has mentored and advised many new employees and students and has been the principal author or co-author of numerous scientific reports and papers. Dave is a recognized leader in statistical methods of hydrology within the USGS and within the hydrologic communities in Minnesota. The quality of his research has earned him the respect of his colleagues and reflects his dedication to the goals of the USGS and the DOI.
Nation Research Program Lectures at the Minnesota Water Science Center
Dr. Christopher S. Magirl, USGS Washington Water Science Center-- Geomorphic response of rivers downstream from retreating glaciers on Mount Rainier, Washington
October 25 at 10:00am
Glacial retreat in response to climate change is a widely observed and documented phenomenon, and the potential effects on downstream water supplies have received considerable study. In the Pacific Northwest, the impact of glacial retreat on downstream fluvial geomorphology is also proving significant. In Mount Rainier National Park, the Park Service found that rivers have filled with sediment effectively raising some riverbeds several meters during the 20th century. This rapid sedimentation appears to be related to glacial retreat, which exposes unconsolidated moraine material to erosion and subsequent debris-flow activity that loads main-stem mountain rivers with copious sediment. This sedimentation may also be a function of the strength and timing of autumnal storms that effectively mobilize and transport sediment. Our research in rivers draining Mount Rainier, 25-100 km downstream from the park boundary, shows sedimentation has raised riverbeds up to 2 m since the 1980s. Analysis of gaging data from the watershed shows both rapid incision and sedimentation suggesting pulses of bedload may be moving through the system as kinematic waves. The size of mobilized sediment ranges from fine silts and clays (colloquially known as glacial flour) to cobbles and boulders creating unique management issues at different locations along the rivers. Moreover, analysis of the geomorphology and sediment transport of the system, given the wide spectrum of sediment size, requires the application of multiple analytical tools including instrumentation to measure suspended-sediment load, geographic information system approaches to calculate sediment budgets, reservoir surveys, pebble counts, analysis of meteorological data, and hydraulic modeling of rivers to estimate downstream flux of sediment through time. Determining the timing of arrival and volume of mobilized alluvium is a critical need for downstream resource managers given the potential impacts of sedimentation on flood-conveyance capacity, fish habitat, and saltwater tidal wetlands.
Dr. Ian R. Waite, USGS Oregon Water Science Center-- Application of Watershed Disturbance Models to Predict and Assess Biological Integrity of Stream Ecosystems
November 9 at 10:00am
There is a heightened interest throughout the scientific community in innovative ecological modeling techniques. Many aquatic researchers in stream ecology are currently developing predictive models by including various combinations of landscape based variables (e.g., urban and agricultural land use, land cover, population density, and hydrological alteration) as a measure of watershed disturbance. These variables then act as the explanatory variables in the models, or the predictors of biological condition at stream sites. Historically, models relied primarily on multiple regression procedures, however, many newer modeling techniques are being employed, including (1) classification and regression tree (CART) methods, (2) structural equation modeling (SEM) and (3) multilevel-hierarchical models. The relation between watershed disturbance and biological communities will be demonstrated through the use of new quantitative ecological modeling methods for studies examining spatial variability and scale, including: A) development of macroinvertebrate watershed disturbance predictive models for three distinct regions in the western U.S; B) the use of coupled models at two spatial scales (national and regional) to better understand nutrient enrichment in agricultural influenced watersheds for macroinvertebrates and algae; and C) the effect of spatial scale on model performance (current research in four contiguous ecoregions). Important insights are gained regarding the role of near-stream (riparian) versus whole-watershed conditions as predictive variables.
USGS Midwest Mining Initiative/TESNAR workshop - Understanding the Impacts of Mining in the Western Lake Superior region (Minnesota, Wisconsin, and Michigan), September 12-14, 2011, Bad River Lodge, Casino, and Convention Center
William Cannon, USGS, describes the geologic
history of the Palms Formation and
Ironwood Iron-formation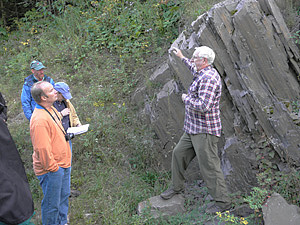 |
The U.S. Geological Survey, the Bad River Band of Lake Superior Chippewa, the Fond du Lac Band of Lake Superior Chippewa, and Great Lakes Indian Fish & Wildlife Commission held a three-day workshop providing technical information on the current state and potential impacts of mining in the Western Lake Superior region. Recently proposed mining activities in the region have become a major concern to many tribes and local communities in Minnesota, Wisconsin, and Michigan. More than 150 people attended the workshop, from over 50 tribal, federal, state, and local government agencies; universities, nonprofit organizations, private consulting firms, and mining companies. Twenty-four presenters from federal, state, and tribal government agencies and private organizations and foundations provided valuable information to individuals addressing environmental assessments related to mining and its impact on different types of ecosystems. Workshop session topics were Western Lake Superior Region mining and risk; Mineral deposits, associated geology, and mineral economics; Mining and the environment; Mine permitting; and Geochemistry, Water, and Sediments. The workshop was oriented towards individuals who require knowledge needed to evaluate the potential effects of mining activities on valuable resources that are significant parts of the cultural heritage of the tribes. The workshop agenda, powerpoint presentations, and photos can be found at the TESNAR page. The audio of some of the workshop presentations were recorded by WOJB Woodland Community Supported Radio.
During the afternoon of the third day, a field trip was done covering the geology, geomorphology, and environmental monitoring in the Bad River watershed. The objective of the field trip was to present the geology of the area and provided a "hands-on" experience with baseline characterization of potential mining environments and associated monitoring designs and equipment. The field trip consisted of three stops. The first was at Copper Falls State Park where Tom Fitz (Northland College), Bill Cannon (USGS), and Laurel Woodruff (USGS) described the geology and Bad River geomorphology in the park. The second stop visited outcrops of the Palms Formation and Ironwood Iron-Formation along Ballou Creek, where Bill Cannon (USGS) and Klaus Schulz (USGS) described the geology of the formations. The third and final stop was at a streamgage on Tyler Forks where Krista Stensvold (USGS), Andrew Lindlof (USGS), Matt Hudson (Bad River Watershed Association), John Coleman (Great Lakes Indian Fish and Wildlife Commission), and Laurel Woodruff (USGS) presented information on the monitoring of streamflow, bed-sediment chemistry, and water quality on Tyler Forks. The field trip agenda is posted on the TESNAR page .
Major Sources and Losses of Nutrients from Watersheds in the Upper Midwest Part of the United States, with emphasis on the Great Lakes Basin
SPARROW Mapper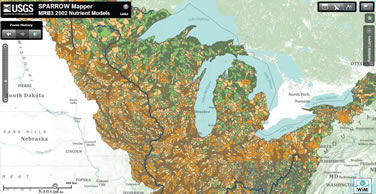 |
New SPAtially Referenced Regression On Watershed attributes (SPARROW) models were developed for the Upper Midwest part of the United States and used to estimate nutrient loads in streams (including unmonitored streams) and identify sources of those loads to the Great Lakes and the Upper Mississippi, Ohio and Souris-Red-Rainy Rivers. For the U.S. part of the Great Lakes Basin, agriculture was found on average to be the largest source of both nitrogen and phosphorus to the Lakes (33 - 58% of the total); however, point sources were still a major source of nutrients to some lakes (13-44% of the total). Collectively, for the Great Lakes this led to highest loads and yields into Lake Erie and the lowest loads and yields into Lake Superior.
The report has been released in the Journal of the American Water Resources Association
Modeling results are available through a new Decision Support System that allows the user to display maps of the model predictions, relate upstream sources to downstream loads and test potential management scenarios. Modeling results summarized by major watersheds, large tributaries and hydrologic units for this area are also available through an easy to use web interface. Additional information about SPARROW modeling in the Upper Midwest and the Mississippi River Basin can be found at: http://wi.water.usgs.gov/rna/9km30/index.html
For additional information on the regional model and the decision support system, contact:
Dale Robertson, 608-821-3867
David Saad, 608-821-3865
Dan Sullivan, 608-821-3869
New Project on Predicting Water Level Changes in Crane, Sand Point and Namakan Lakes, MN
A new, cooperative project with the International Joint Commission (IJC) will combine high-resolution bathymetric surveys with water level data and velocity profiles to support development of a working water elevation model of the reservoir system. The model will provide a better understanding of the movement of water through the Namakan Reservoir System while aiding in the management of water levels in accordance with operating rules established by the IJC. The operating rules were designed to meet multiple water demands for ecosystem services, paper production and municipal uses. The model will be developed through two phases. First, bathymetric and velocity surveys of the four pinch points in the Namakan Reservoir System (Namakan, Harrison, King Williams, and Little Vermilion Narrows) will be conducted in 2011. Second, continuous water level data at four control points in pools throughout the reservoir system will be collected in late 2011 and through the ice-free season of 2012. The data will be used to estimate the effects of the pinch points on lake elevations and water movement between the lakes using HEC-RAS water elevation model under development by colleagues at Environment Canada. For more information
Contact: Richard Kiesling
|