LONG-TERM
MONITORING OF SOIL-MOISTURE IN A HARSH CLIMATE
USING
REFLECTOMETER AND TDR PROBES
William N. Herkelrath1 and Geoffrey N. Delin2
1 U.S. Geological Survey,
Menlo Park, CA 94025; wnherkel@usgs.gov
2 U.S. Geological
Survey, Mounds View, MN 55112; delin@usgs.gov
ABSTRACT
An automated data logging system was used to measure unsaturated zone hydraulic properties relevant to evaluating the effects of recharge on dissolution of crude oil at a research site near Bemidji, Minnesota. Laboratory and field testing of several soil-moisture probes indicated that the CS615 “reflectometer” probe was better suited than the CS605 time-domain reflectometry (TDR) probe to the field conditions of having a limited power supply and extreme weather typical of northern Minnesota[MN1]. All probes were manufactured by Campbell Scientific Inc. The reflectometer probes provided dependable and accurate data over long time periods, were somewhat easier to install, and had less data fluctuation than the TDR probes. However, there were problems, both with the reflectometer and TDR probes. Many of the probes that were installed beneath the water table or within the capillary fringe eventually failed. Also, laboratory calibrations run using soil from the field site differed significantly from the calibrations provided by the manufacturer. Recharge estimates based on the horizontal soil-moisture probe measurements varied by about ±25%, possibly because of uncertainty in the calibration curves. The most serious problem with the reflectometer probes occurred when a severe electrical storm apparently caused a permanent shift in the probe calibrations. Some TDR probes that were installed vertically in the unsaturated zone at the bottom of boreholes yielded anomalously high values of soil moisture. It is possible that installation of the vertical probes created a preferential pathway that caused moisture content to increase in the vicinity of the probes.
INTRODUCTION
Long-term monitoring of soil moisture has become routine in the past two decades with the emergence of dataloggers and electronic monitoring equipment (Baker and Allmaras, 1990; Herkelrath et al., 1991; Delin et al., 1997). These types of automated electronic soil-moisture monitoring systems have distinct advantages over the widely used neutron probe method in that they can be automated to collect data unattended, can collect numerous measurements each day, and do not require a radioactive source. Long-term monitoring of soil moisture in cold climates, where temperatures during the winter commonly reach –30oC, can be problematic, particularly when cable testers are required for making time-domain reflectometry (TDR) measurements (Herkelrath et al., 1991; Delin and Herkelrath, 1999). Additional research is needed to evaluate how these types of automated soil-moisture monitoring systems perform over long periods of time in cold climates.
The primary goal of the investigation described in this paper was to determine which of three probes was most appropriate for long-term monitoring of soil moisture at a crude-oil research site near Bemidji, Minnesota. A wide variety of different soil-moisture probes are available. Three Campbell Scientific Inc. probes were used in this study primarily because of a preponderance of compatible equipment already installed at the site (use of trade names does not constitute endorsement by the U.S. Geological Survey). Probe length is a factor that has been evaluated in previous studies. Zegelin et al. (1992) found that measurement of travel times becomes inexact for shorter probe lengths. We evaluated the effects of a 50-cm long probe versus the more standard 30-cm long probe.
A secondary goal was to investigate the effects of
probe orientation on soil-moisture measurements and ground-water recharge
estimation. Soil-moisture probes used for long-term monitoring typically are
installed horizontally in the wall of a shallow pit or trench. One of the
primary reasons for using a horizontally oriented probe is to measure soil moisture
at a single elevation in the soil profile. However, this method of installation
is highly invasive and is generally limited to about the upper 2 m of the
unsaturated zone. Another method of installation is to place the probes
vertically in a borehole. This allows installation of the soil-moisture probes
at any depth within the unsaturated zone. A disadvantage of this type of
installation is that the collected data do not represent a single depth but
rather the average soil-moisture measured over the entire vertical length of
the probe. Another disadvantage is that the borehole above the probe is
backfilled with soil that may be poorly compacted, which could alter the
vertical flow of water. Thus, the soil-moisture measurements using a vertical
installation may not be representative of the undisturbed native soil. Little
is known of how probe orientation affects soil-moisture measurements.
This research was part of a larger study designed to better understand the effects of recharge on the dissolution and movement of oil through the unsaturated and saturated zones at the research site. The soil-moisture data were used to estimate recharge during 1999 based on an unsaturated-zone water balance method. [MN2]
Location
And Description Of Research Area
On
August 20, 1979, approximately 16 kilometers northwest of Bemidji, Minnesota,
the land surface and shallow subsurface were contaminated with crude oil when a
pipeline burst, spilling about 1,700,000 L of crude oil onto a glacial outwash
deposit. After cleanup efforts were completed, about 400,000 L of crude oil
remained at the site. Some crude oil percolated through the unsaturated zone to
the water table near the rupture site (north oil pool, fig. 1). Some of the oil
flowed over the land surface toward a small wetland forming two other areas of
oil infiltration (middle and south oil pools).
Sediments
at the site consist of poorly sorted glacial outwash sand of fine to very
coarse grain size, with some fine gravel and cobbles. One- to 10-mm thick
iron-cemented laminations occur between depths of 0.3 and 1.0 m at the south
oil pool. Crude oil (about 0.1-0.5- m thick) floats on the water table, which
is about 2.7 m below land surface at the south oil pool. At a depth of about 25
m, a regionally persistent and uniform layer of low permeability till restricts
vertical ground-water movement.

Methods
An
automated data-logging system was installed near Well 981 (south oil pool; fig.
1) in late 1996 to compare the performance of several different soil-moisture
probes used to estimate recharge at the site. Other data measured continuously
at the site included soil temperature (at 50-cm depth intervals), ground water
level in nearby Well 9714, and precipitation. The soil moisture and other data
were collected every four hours from late 1996 to July, 2000. Data logger water
levels were calibrated monthly using an electric contact gauge. Solar-charged
batteries initially powered the Campbell Scientific CR10X data logger and the
TDR system. The batteries were replaced in the fall of 1997 with 110-volt AC
power supply.
Three
types of Campbell Scientific soil-moisture probes were installed at the Well
981 site. The CS615 probes were 30-cm long and had 2 prongs (Bilskie, 1997).
The CS615 is a self-contained “reflectometer” that does not require a TDR cable
tester to determine water content. This probe was compared to 30-cm long and
50-cm long TDR probes that require a cable tester. A two-meter-deep pit was
dug, and 3 vertical profiles of probes were installed in the pit. Each profile
consisted of 6 probes of the same type. A total of 18 probes were installed in
the pit. The three vertical profiles were separated laterally by about 0.5
meters. The uppermost 4 probes were pushed horizontally into the undisturbed
soil in the pit wall at depths of 50, 100, 150, and 200 cm. Small boreholes
were dug in the bottom of the pit, and the lowermost two probes were installed
vertically into the soil at the bottom of the boreholes at depths of 250 and
300 cm below land surface. The pit and boreholes were backfilled with soil
after the probes were installed. An array of 6 vertically oriented, 30-cm long
TDR probes was also installed at 50-cm depth intervals in small-diameter
boreholes located about 2 m southwest of Well 981 (fig. 1). The boreholes were
backfilled with soil after the vertical probes were installed.
Using
the methods described in Herkelrath et al. (1991), the three types of
soil-moisture probes were calibrated in the laboratory using repacked,
10-cm-diameter columns of sandy sediments obtained from the field site. Each
probe was inserted into the top of its own dry column. The columns were kept
vertical throughout the calibration. After the probes were installed, each
column was saturated with water from the bottom through a tube. Relative
permittivity of the sediments was determined for the saturated sample using
each soil-moisture probe. Each column was drained in a series of steps by
suction of water out the bottom. Soil permittivity and column mass was measured
at each moisture-content step. At the end of the experiment the soil was
removed and oven dried. Total water content corresponding to each measurement
was calculated from the difference between the measured column mass and the
oven-dry mass. Volumetric water contents were assumed to equal the ratio of
total water content to soil volume.
Ground-water
recharge estimation using the soil-moisture data was based on the zero-flux
plane (ZFP) water-balance method (Richards et al., 1956). The ZFP is defined as the horizontal plane
in the unsaturated zone where the vertical hydraulic gradient is equal to zero.
According to this hypothesis, water in the soil above the ZFP moves upward in
response to evapotranspiration, and water below the ZFP drains downward to the
water table. We assumed that water that infiltrates into the “recharge zone”
below the ZFP is unavailable for evapotranspiration and results in “recharge.”
The
elevation of the ZFP changes during the year. The ZFP is near land surface
during the winter months when evapotranspiration is low, and then moves
downward as evapotranspiration demand increases in summer. Unfortunately, our
knowledge of the location of the ZFP in this study was limited. Tensiometers
were installed at the Well 981 site to measure the soil-water potential profile
and estimate the ZFP elevation, but the instruments failed and the measured
data could not be used. However, tensiometer data obtained at a nearby location
at the north oil pool (fig. 1) indicated that the ZFP depth was above a depth
of 1.0 meter throughout the year. We assumed that similar ZFP depths existed at
the south pool.
To
estimate recharge using the soil-moisture probe measurements, we calculated the
maximum increase in the total volume of water present in the recharge zone that
occurred during each recharge event:
Rj = Vjmax
- Vjant .
(1)
Rj is the recharge per unit cross section
that occurred during recharge event j, Vjant is the total volume
(per unit cross section) of moisture present antecedent to the event, and Vjmax
is the maximum moisture volume measured during the recharge event. The
total volume of moisture in the recharge zone, per unit cross section, was
estimated by
![]() ,
(2)
,
(2)
where
i is an index to the soil-moisture probes (equal to one for the probe nearest
the water table and increasing upward to a value of M for the probe nearest the
ZFP), qi
is the soil moisture content measured by probe i, and Dzi is the
vertical thickness of the unsaturated zone associated with probe i. The annual
recharge is assumed to equal the sum of the individual recharge events during
the year.
Recharge
was also estimated by applying the method of hydrograph analysis (Rasmussen and
Andreason, 1959) to water-level data from nearby Well 9714. In this method, the
measured change in water-table elevation in a well was used to estimate the
change in the amount of water stored in the aquifer. The change in storage was
attributed to recharge. At the study site, recharge was assumed to equal the
water table rise multiplied by the assumed aquifer specific yield of 0.3.
RESULTS AND DISCUSSION
Probe calibration
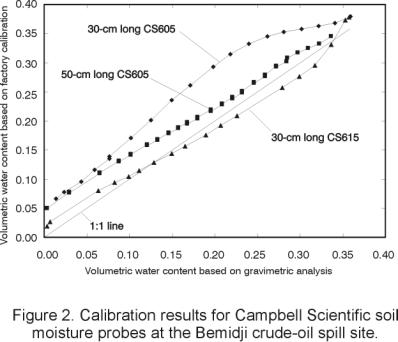
Results
of laboratory calibration tests indicated that the volumetric water content
calculated using the factory-supplied calibration for the CS615 “reflectometer”
probe was accurate to within about +/- 0.02 cm3/cm3 of
the volumetric water content based on gravimetric analyses over the entire
moisture-content range (fig. 2). On the other hand, the volumetric water
content based on the factory-supplied software for the TDR probes was
consistently greater than the volumetric water content based on gravimetric
analyses. The lab calibration for each probe type was assumed to apply to all
field probes of the same type. Water content measurements obtained in the field
using the factory-supplied software were corrected using the functional
relationships graphed in figure 2. Each curve was fit to a polynomial function
that was used to calculate “actual” moisture content from the “factory” value.
Comparison of soil-moisture probe performance
in the field
The
two-pronged reflectometer probe was easier to install than the three-pronged
TDR probe, largely because of increased friction and the enhanced likelihood of
hitting gravel with three prongs. However, care was required during
installation of the reflectometer probes to ensure that the internal circuitry
of the reflectometer was not damaged. The 50-cm long TDR probes were most
difficult to install because of their greater length, which increased friction
and the likelihood of hitting gravel.
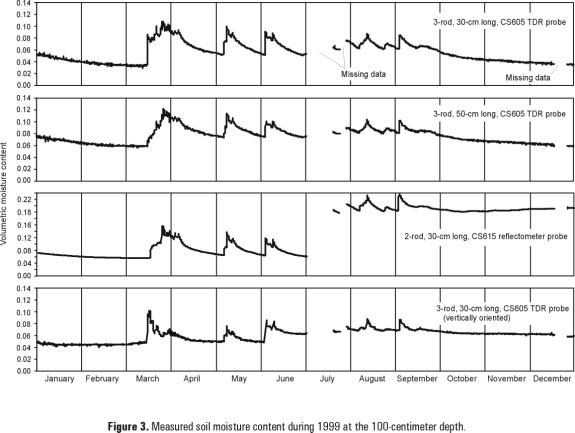
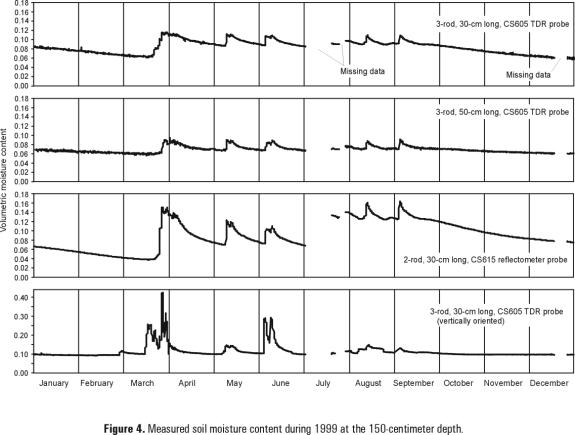
As
an example of the data collected during this study, soil-moisture measurements
collected during 1999 from the probes located at the 100 and 150 cm depths are
shown in figures 3 and 4. Data were lost as a result of an electrical storm on
July 3, 1999 and also during a period of time in December 1999. These periods
of record are labeled “Missing data” in the figures.
The
3 horizontal soil-moisture probes at each depth detected wetting front arrival
at approximately the same time following precipitation events. However, the
magnitude of the response of horizontal probes installed at the same depth
differed by as much as 0.07 cm3/cm3. It is possible that
spatial variability in particle size and soil structure resulted in this much
variability in soil moisture. However, it is also possible that most of the
measured variability was an artifact caused by the fact that the calibration
curve varies from probe to probe, and as a function of soil structure.
There
was an anomalous change in measured soil moisture for the reflectometer probes,
which
resulted
from damage caused by the severe storm on July 3, 1999. Day-to-day changes in
soil
moisture
measured by these probes from July through December 1999 are reasonable.
However,
the
moisture-content vs. time curve for each probe (figs. 3 and 4) appears to be
shifted by
a
constant amount after the storm. We hypothesize that an element of the
reflectometer
circuit
in each probe was permanently damaged by the lightning strike. We estimated the
amount
of the curve shift caused by the storm by comparing steady soil moisture
content
values
obtained using the reflectometer probes in winter before and after the storm.
The
shifts
in the measured soil moisture content varied from +0.11 to -0.03 cm3/cm3. We
plan to
retrieve
the probes at the end of the experiment and investigate the nature of the
damage.
Soil-moisture
values measured with the reflectometer probes were more stable and had less
data fluctuation (“noise”) than those measured with the TDR probes. The
background noise level for probes in the upper 200 cm of the unsaturated zone
was estimated using the soil moisture measurements taken during the winter
months of January through March 1999. During this period, the soil was frozen
to a depth of about 60 cm and the soil moisture was relatively constant at all
depths. The first step in estimating the noise in the moisture content vs. time
data was to smooth the data by calculating the running median of each group of
five consecutive measured values. The noise was then estimated by calculating
the root-mean-square difference between the raw moisture content vs. time curve
and the smoothed curve for the entire winter. The noise in the reflectometer
probe data (~6 x 10⁻⁵) was much less than for the TDR probes (~1 x
10-3).
Data
loss for the reflectometer probes were much less than for the TDR probes in the
upper 200 cm of the unsaturated zone. Loss of data could critically affect
recharge estimates resulting in inaccurate or missing estimates. Only 0.7, 0.0,
and 0.4 percent of the reflectometer data were lost during 1997, 1998, and
1999, respectively. Average data loss for the TDR probes was 17.9, 11.3, and
4.9 percent, respectively, in 1997, 1998, and 1999. Data losses as a result of
the July 3, 1999 electrical storm were not included in the calculation of losses
for 1999. Most of the data loss for the TDR probes occurred when the cable
tester could not detect the end of the soil-moisture probe, which resulted in
out-of-range values. Apparently, the signal reflected from the end of the TDR
probe was not of sufficient amplitude. A minimal amount of the data loss for
the TDR probes resulted from variations in power supply voltage and line noise
that caused out-of-range values.
Data
losses for the TDR probes in the capillary fringe (250-cm depth) and below the
water table (300-cm depth) were significant, averaging 31 and 52 percent of the
time, respectively, during 1999. In many of these cases, the cable tester
failed to detect the end of the parallel rods in the saturated or
near-saturated moisture conditions, resulting in an over range soil-moisture
value. Unrealistically large values (greater than aquifer porosity) were also
recorded by the TDR probes. Data losses for the reflectometer probe at the
250-cm depth were 29 percent prior to the July lightning strike. Data losses
for the reflectometer probe at the 200-cm depth were zero before the July
lightning strike, but the probe failed to collect any accurate data following
the storm. In addition to overrange values, the reflectometer probes at these
depths also recorded erroneously large and small soil moisture values.
Long-term data collection in the capillary fringe and below the water table was
erratic using both the TDR and reflectometer probes. Many of the TDR and
reflectometer probes in the capillary fringe and below the water table
eventually failed completely. Apparently, the poor performance and failure
of the probes was caused by long-term exposure to saturated or nearly saturated
conditions.
During
the time when the monitoring system was powered by solar-charged batteries,
data losses for the TDR probes increased during the winter months when air
temperatures were below -10oC. This increased data loss was likely
due to insufficient solar radiation during the winter to charge the batteries
to power the cable tester. On the other hand, the reflectometer probes had
sufficient power to make measurements during the winter months. This problem of
insufficient battery power for the cable tester was corrected by installation
of 110-volt power supply in November 1997.
Ground-water
recharge estimates
Ground-water recharge based on the zero-flux plane (ZFP) method was estimated at the Well 981 site for the six primary events in 1999 in which precipitation exceeded 2.0 cm. Recharge was not detected by the probes for rainfall events of less than 2.0 cm. As shown in Table 1, the estimated recharge decreased as the assumed depth of the ZFP increased. For a given assumed ZFP depth, [MN3]there was good agreement between the recharge estimates obtained using the horizontal TDR probe data. However, the recharge estimates for both the horizontal reflectometer probes and the vertical TDR probes were higher than the estimates for the horizontal TDR probes. The recharge estimates were significantly affected by changes in the calibration curve used to interpret the probe data. For example, as shown in Table 2, recharge estimates based on the factory calibration curves changed as much as ±25% compared to estimates obtained using the laboratory calibrations (Table 1).
The annual recharge estimated using the horizontal reflectometer and TDR probe data varied from about 25% to about 60% of 1999 precipitation, which was 82 cm. These results are similar to measurements obtained in other sand plain areas of the region, which indicate recharge typically ranges between 10 and 40 percent of total annual precipitation (Delin et al., 2000). On the other hand, the annual recharge estimated using the vertically oriented TDR probes was about 90% of precipitation, which is unreasonably high. Recharge estimated using hydrograph analysis (Rasmussen and Andreason, 1959) was about 20 cm, which compares most favorably with the horizontally oriented TDR probes with the ZFP at a depth of about 75 cm.
|
|
1999 estimated recharge in cm for each probe (lab calibration) |
|||
|
Assumed ZFP depth in cm |
CS605-30 (Horiz. TDR) |
CS605-50 (Horiz. TDR) |
CS615 (Horiz. Reflectometer) |
CS605-30 (Vertical TDR) |
|
25 |
30 |
30 |
49 |
76 |
|
50 |
26 |
25 |
44 |
74 |
|
75 |
22 |
21 |
41 |
71 |
Table 1. Recharge estimates based on soil-moisture measurements. Probe calibrations were based on laboratory experiments carried out using soil from the field site.
|
|
1999 estimated recharge in cm for each probe (factory calibration) |
|||
|
Assumed ZFP depth in cm |
CS605-30 (Horiz. TDR) |
CS605-50 (Horiz. TDR) |
CS615 (Horiz. Reflectometer) |
CS605-30 (Vertical TDR) |
|
25 |
38 |
27 |
39 |
69 |
|
50 |
33 |
22 |
35 |
65 |
|
75 |
29 |
18 |
33 |
62 |
Table 2. Recharge estimates based on soil-moisture
measurements. Factory probe calibrations were used in these estimates.
Effects
of Probe Orientation
Vertical
probe orientation did not affect the noise in the data. The root mean square
variance for the vertically oriented TDR probes was about the same as for the
50-cm long horizontally oriented probes. Data losses were nearly identical for
all of the TDR probes in 1997, 1998, and 1999 irrespective of probe
orientation. The magnitude of change in measured soil moisture in response to
recharge events was not affected by probe orientation at the 50- and 100-cm
depths (fig. 3), where changes were very similar for the horizontally and vertically
orientated probes. However, at the 150- and 200-cm depths the magnitude of
change in measured soil moisture for the vertically oriented TDR probes
generally was two to six times greater in response to the recharge events (fig.
4). The vertically oriented TDR probes at the 150- and 200-cm depths typically
detected wetting front movement hours to days earlier than the other probes at
similar depths.
A
likely factor contributing to the anomalously large changes in soil moisture at
the 150- and 200-cm depths is the presence of crude oil. Crude oil was detected
in the ground during installation of these vertically oriented probes. The oil
may have caused a hydrophobic condition in the surrounding soil matrix. The
installation of a vertical probe may have created a preferential pathway for
flow of water. The preferential pathway could result in increased soil moisture
content adjacent to the probe over a prolonged period of time. “Fingering” or
“funnel flow” of water through hydrophobic soils is well documented (Wallis and
Horne, 1992). In addition, the presence of crude oil in direct contact with the
probes could have caused a change in the calibration curve.
Soil
heterogeneity could also contribute to inconsistent response of the vertically
oriented probes at the different depths. Although the soil at the site is
mostly sand, there are isolated layers of silt, which have lower permeability
and tend to impede infiltration. If the 150- and 200-cm probes penetrated silt
layers, the probe electrodes could have created a localized preferential
pathway through the silt, resulting in increased vertical movement of water.
Variability in the material filling the borehole above the vertically oriented probes may also have been a contributing factor to the inconsistent response of these probes. If the soil is nearly saturated, poorly compacted fill material in a borehole may have a high permeability and provide a preferential pathway for moisture. On the other hand, under dry conditions, poorly compacted fill material may be drier than the surrounding soil. Relatively dry fill material would tend to reduce soil moisture flow. Drilling and refilling of boreholes also destroys the layered soil structure in the borehole. Infiltrating water can be diverted laterally by silt layers in the unsaturated zone, and then “funneled” rapidly downward when a borehole filled with homogeneous sand is encountered (Kung, 1990). Further research into the effect of probe orientation on TDR measurements is warranted.
SUMMARY AND CONCLUSIONS
Laboratory
and field testing of the soil-moisture probes indicated that the Campbell
Scientific CS615 “reflectometer” probe was better suited than TDR probes to the
field conditions of having a limited power supply and extreme weather typical
of northern Minnesota. Field testing also indicated that (1) the reflectometer probes provided
a dependable and accurate means for long-term monitoring of soil moisture in
the glacial outwash being studied; (2) the reflectometer probe was somewhat
easier to install in sandy soils than the standard TDR probe; and (3) data from
the reflectometer probes had less “noise” than data from the standard TDR
probes.
However,
there were problems with both the reflectometer and TDR probes. Many of the
probes that were installed beneath the water table or within the capillary
fringe eventually failed. Also, laboratory calibrations run using soil from the
field site differed significantly from the calibrations provided by the
manufacturer. Recharge estimates based on the horizontal soil-moisture probe
measurements varied about ±25%, possibly because of
uncertainty in the calibration curves. The most serious problem with the
reflectometer probes occurred when a severe electrical storm caused a permanent
shift in the probe response. After the storm, day-to-day changes in the
moisture content values obtained using the reflectometer probes were
reasonable, but the moisture-content vs. time curves appeared to be shifted by
a constant amount. Some TDR probes that were installed vertically in the
unsaturated zone at the bottom of boreholes yielded anomalously high values of
soil moisture. It is possible that installation of the vertical probes created
a preferential pathway that caused moisture content to increase in the vicinity
of the probes. It is also possible that the anomalous response of the vertical
probes was caused by crude oil or hydrophobic soil contacting the probes.
REFERENCES
Baker, J.M, and Allmaras, R.R., 1990,
System for automating and multiplexing soil moisture measurement by time-domain
reflectometry: Soil Sci. Soc. Am. J., 54,1-6.
Bilskie, Jim, 1997, Using dielectric
properties to measure soil water content: Sensors, 14, 26-32.
Delin, G.N., Healy, R.W., Landon, M.K.,
and Böhlke, J.K., 2000, Effects of topography and soil properties on recharge
at two sites in an agricultural field: Am. Water Res. Assoc. J., 36, 1401-1416.
Delin, G.N., Landon, M.K., Nelson, K.J.,
Wanty, R.B., Healy, R.W., Olsen, H.W., Böhlke, J.K., Schroyer, B.R., and Capel,
P.D., 1997, Hydrogeologic and water-quality data used to evaluate the effects
of focused recharge on ground-water quality near Princeton, Minnesota: 1991-95:
U.S. Geological Survey Open-File Report 97-21, 30 p.
Delin, G.N., and Herkelrath, W.N., 1999,
Long-term monitoring of unsaturated-zone properties to estimate recharge at the
Bemidji crude-oil spill site: U.S. Geological Survey Water Resources
Investigations Report WRIR 99-4018C, 143-151.
Herkelrath, W.N., Hamburg, S.P., and
Murphy, Fred, 1991, Automatic, real-time monitoring of soil moisture in a
remote field area with time-domain reflectometry: Water Resources Research, 27,
857-864.
Kung, K. –J.S., 1990, Preferential flow
in a sandy vadose zone: field observation: Geoderma, 46, 51-58.
Rasmussen, W.C., and Andreason, G.G., 1959,
Hydrologic budget of the Beaver Dam Creek Basin Maryland: U.S. Geological
Survey Water-Supply Paper 1472, 106 p.
Richards, L.A., Gardner, W.R., and
Ogata, G., 1956, Physical processes determining water loss from soil: Soil Sci.
Soc. Amer. Proc., 20, 310-314.
Wallis, M.G., and Horne, D.J., 1992,
Soil water repellency: Advances in Soil Science, 20, 91-146.
Zegelin, S.J., White, Ian, and Russell,
G.F., 1992, A critique of the time domain reflectometry technique for
determining field soil-water content: Proceedings of Soil Science Society of
America symposium Advances in Measurement of Soil Physical Properties –
Bringing Theory into Practice, SSSA Special Publication no. 30, 187-208.